Have Vaulting Valuations Already Cleared the High Bar?
Market analysts can be so fixated on the short-term impact of a recession, that they may miss some important long-term trends that the inflation spike and recession fears are masking. The dual hit of the COVID pandemic and the resurgence of a Cold War environment are causing changes to the corporate supply chains and free trade that have been rapidly globalizing for the last three decades. The question we are asking this quarter is, have we hit a fundamental, decade-long inflection point where higher interest rates are sustained, corporate profits become constrained, and the risk appetite for stocks and bonds becomes more restrained?
The question of whether there is going to be a recession is posed by the financial press as almost a binary one. Will it? Won’t it?
A recession right now, amid strong job growth, would likely be mild — something of a medically induced coma orchestrated by the Federal Reserve interest rate tightening. A low-grade slowdown could affect stock market valuations for a year or two, but stock prices are valued based on decades of projected earnings, not a year or two.
Strategists and financial analysts are so focused on the short-term impact of a recession, that they may be missing some important trends that the inflation spike and recession fears are masking for the long term. The question we are asking this quarter, is have we hit a fundamental, decade-long inflection point where higher interest rates are sustained, corporate profits become constrained, and the risk appetite for stocks and bonds becomes more restrained?
That’s a pretty big question. Yet it is worth asking ourselves whether the dual hit of the COVID pandemic and the resurgence of a Cold War environment may cause some changes to the corporate supply chains and free-trade world that have been the hallmark of the post-Soviet era. The falling interest rates that we have enjoyed since the fall of the Berlin Wall and the acceleration of free trade may be at a juncture where we could see valuations begin to decline.
The Situation with Valuations
Last quarter, we discussed how stock prices generally are biased toward the upside. Stock prices realize compounded returns over time because companies grow their profits, not just their share prices. However, we want to explore another side of this — namely are the high equity valuations sustainable. When we talk about ‘valuations’, we generally mean how much investors are willing to pay for a company’s stock relative to its earnings. There are many metrics for measuring this, but the indisputable fact is that stock prices (a.k.a., equity prices) have been increasing over the last 15 years at a faster rate than earnings have grown. This is great for equity investors, because overall returns have been higher than they would have been if investors were just relying on the growth of companies’ earnings. But are these valuations sustainable over the next decade or two? [1]
It is stunningly difficult to predict human behavior when you consider how predictable that behavior is. Hindsight is not 20:20 – it is more like 20:40. We are good at seeing trends after the fact, but we also tend to be near-sighted in our interpretations that miss some trends further out.
Figure 1
Source: Bloomberg
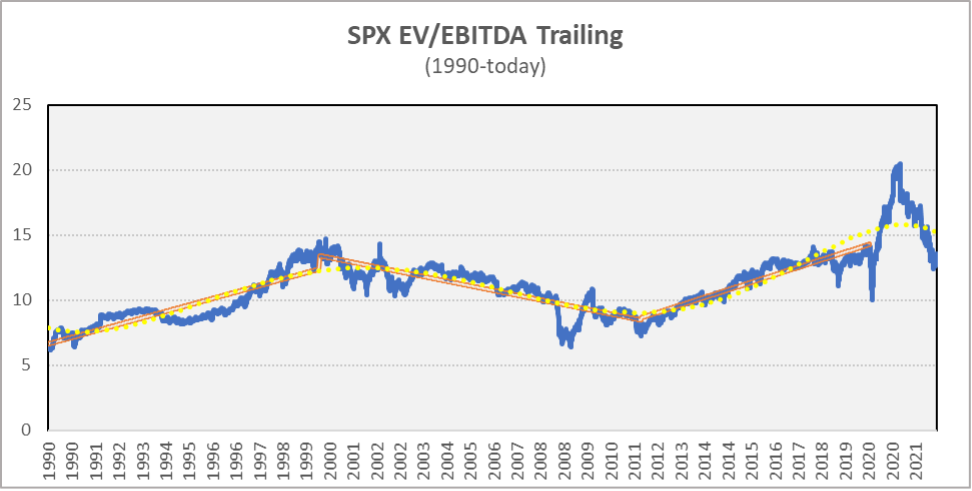
Here is a graph that gives a bird’s-eye view of valuations since 1990. [2]
This chart shows the EV/EBITDA ratio for the S&P 500, which is a broader metric of valuations. The higher the ratio, the higher the overall risk appetite has become for corporate stocks and bonds (aggregated together). You have seen this graphic before in our previous quarterly notes, but we have never produced it for such a long period as we are showing you here. In fact, this is the longest time horizon that Bloomberg even has available, starting in early 1990.
We also added trend lines — regression lines to be more specific. The yellow dotted line is a polynomial regression ‘best fit’. To underscore the point, we also did simple linear regression lines from peak to trough of the three, decade-long, valuation trends. What we see clearly here is that valuations (and therefore risk appetite) increased pretty steadily, starting with the collapse of the East Bloc and Soviet Union, then ending with the puncturing of the dot-com bubble. Valuations then decline progressively back to where they started (more or less) over the course of half a generation. At the bottom of the Great Recession, that trend reversed itself again and started to climb gradually to reach all-time highs. Then, the pandemic and the Fed response injected so much money into the system that there was a huge spike in valuations outside of the normal trends, though those have fallen back sharply this year. Even so, valuations are still pretty high by historical standards.
Let’s pause here for a second to remind ourselves what these ratios mean. On average, the S&P 500 companies traded at a ratio of about 10 times their total earnings before tax and non-cash items. This means that if these companies did not grow their earnings at all, it would take 10 years of earnings to pay the costs of all the debt and (notionally) the shares outstanding for those companies. Prior to the pandemic, the S&P 500 valuation had reached nearly 15 times its earnings, and during the pandemic liquidity bubble of 2020-2021, valuations hit an all-time high of 20 times. That means we went from an average of 10 times earnings to 20 times earnings in just a decade. How is this possible?
There are a lot of factors at play that spurred this increase in valuations, but the most notable has been long-term interest rates. The following chart shows what a 10-year US government treasury bond yielded (the interest rate) for the same period since 1990:
Figure 2
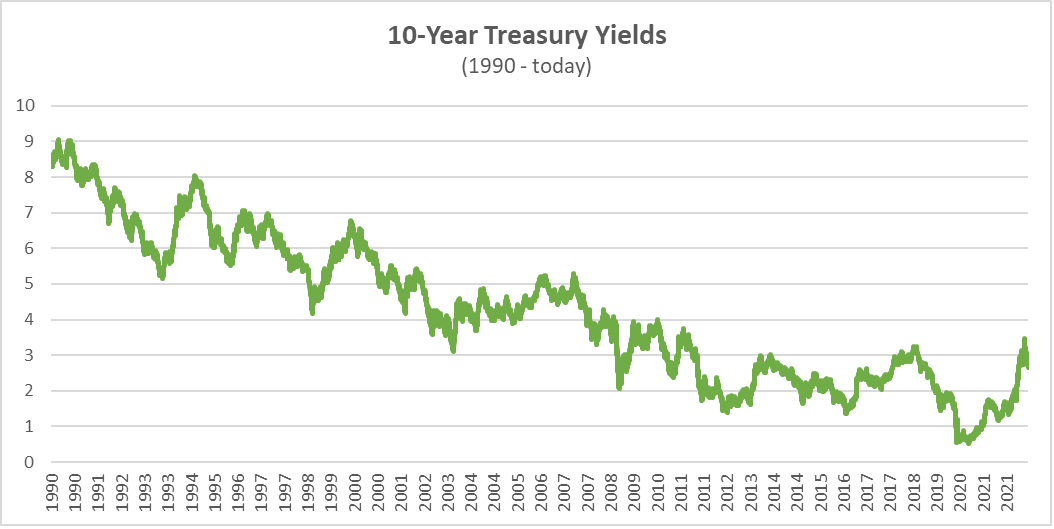
It doesn’t take any regression line here to see that the yield on 10-year treasuries has been on a downward trajectory for 30 years, with periodic feints upward. This means that the U.S. government has been paying less and less to finance its budget deficits.
Next, let’s take a look at the same stock market valuation chart plotted next to corporate bond yields (right axis). Corporate bond yields typically are priced with a ‘spread’ over treasury yields. Except in very big crises of confidence (think 2008 mortgage meltdown), the corporate bonds have been following the same general downward trajectory as US 10-year treasuries.
Figure 3
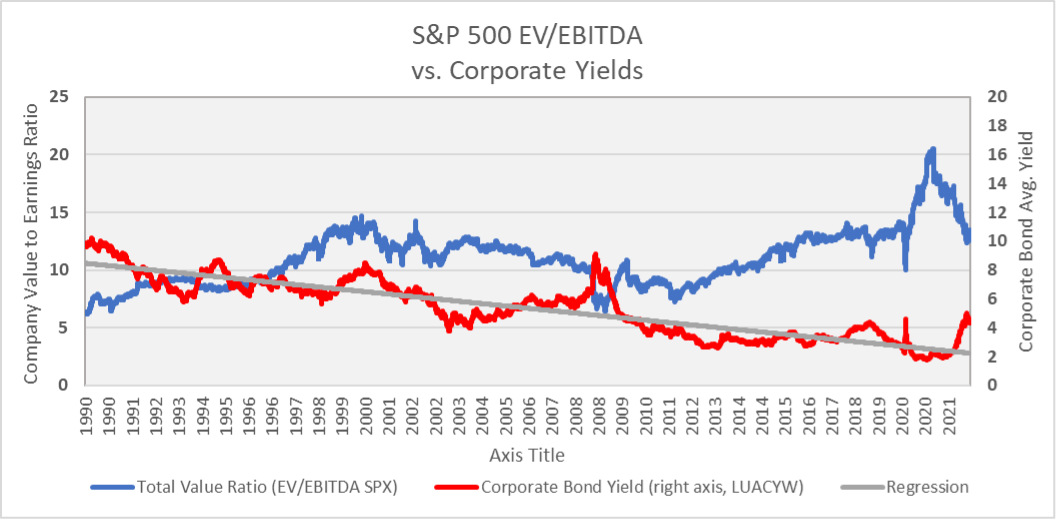
There was an inexorable downward trend in corporate bond rates from low double digits down to an average of around 2%, driven largely by the broader decrease in US Treasury yields (i.e., interest rates). However, overall corporate valuations see-sawed over three, decade-long trends. You would expect as the cost of debt declines for companies, their valuation would go up, all other things equal (bond prices go up when yields go down).[3] And you can see that this is true overall, but there is more going on here with the equity component. Lower borrowing costs for companies can push up valuations (increase investors’ appetite) in a number of other ways:
- Reinvestment. Companies can afford to buy more plant and equipment, which allows them to grow faster;
- Lower Interest Payments. The cost of servicing their debt is lower, so companies have more cash flow that is available to equity;
- Mergers & Acquisitions. Companies can use debt for leveraged mergers and acquisitions;
- Share Buybacks. Probably most importantly over the last decade, many companies have effectively been borrowing at cheap interest rates in order to buy back their own shares. This creates upward pressure on their stock price, and it also reduces the number of shares that are in the market, thus making each share have a higher earnings component.
Clearly, there are a lot of reasons why a low interest rate environment can be good for stockholders and can help push valuations higher. The question is, why did interest rates decline over three decades? And for that matter, why did valuations take a breather during the middle of this period, even as interest rates continued their decline?
The first question is complex, but interest rates probably declined because of a number of factors facilitated by the end of the Cold War and the acceleration of the world free-trade regime, both of which lowered inflation. The integration into the world economy of Chinese labor, in particular, brought a huge increase in total available labor and put downward pressure on wage rates more broadly. Perhaps the simplest explanation for the second question on the valuation retrenchment is that interest rates are obviously not the only factor in valuations. Interest rates declined for the first decade after 1990, ultimately culminating in the tech bubble in stocks in 2000. When stock prices collapsed, valuations continued to decline even after the bubble hit bottom, first through 9-11, next through two wars, all the way through the market collapse at the beginning of the Great Recession/mortgage crisis. In other words, there were a lot of negative events that affected stock prices and earnings over that middle decade, and that clearly weighed on valuations. The bursting of stock bubbles will often have a lasting impact on retail traders, driving many of the new investors out of the market after they saw a big portion of their savings evaporate.
The Fed’s Pandemic Shuffle
The most startling piece of this chart is the period starting from the beginning of the COVID pandemic until today: talk about outliers! Valuations during that period blew past record levels set during the dotcom bubble before falling back down at pretty much the same pace until they fell through pre-pandemic levels. Yet the pandemic itself and the Government and Federal Reserve’s response, might just be statistical noise masking a bigger underlying shift that was accelerated by the pandemic. To make this argument, let’s start with the Fed’s creation of over $6 trillion dollars (!) and reducing interest rates to effectively zero. The Fed pushed a severe recession caused by COVID back a couple of years to when the world would have effective vaccines to combat COVID.
Now we may need to tolerate a modest recession when the economy is more resilient in order to bring inflation under control, though that would be a Fed-induced slowdown not a panicked pullback of corporate America. The Fed is not slamming on the brakes, but there is a good deal of brake pumping to avoid a wage-price spiral.[4] Let’s stress again, though, that short of a severe overshoot by the Fed, any resulting recession should only impact valuations modestly.
The Post Pandemic Landscape
What does not get enough emphasis, in our opinion, is the degree to which geopolitical developments over the last six months have changed the investment landscape, perhaps marking the inflection point we alluded to earlier in which a generational decline in valuations may be looming. It is a big statement. So let’s break it down. Russia’s invasion of Ukraine upended the calculus that went into the Fed’s thinking. Vladimir Putin is a cynical, calculating, ruthless tyrant, but in this case he made a critical miscalculation. Putin thought that he could invade Ukraine at this precise juncture because COVID and the resulting supply chain problems were making the economic and inflationary costs too great for the West to react in a unified and effective fashion. He was wrong for a whole host of reasons that go beyond the scope of this white paper. Importantly, he also brought China along for the ride — somewhat reluctantly — as a revived alliance of authoritarian states that saw themselves as the inheritors of a world in which liberal democracy was failing and a “Rules Based System” was being overthrown. (Refer to Quarter 1, 2022 whitepaper on the Russian invasion of Ukraine)
To understand the importance of this, let’s return to the graph in figure 4 but with some key events layered on top. The beginning of this period (and the rise in valuations) started with the collapse of the Berlin Wall, the integration of Eastern Europe into the European Union and NATO, and a rapid rise of free trade agreements. It also represented a juncture when the internet first took on legs.
Figure 4
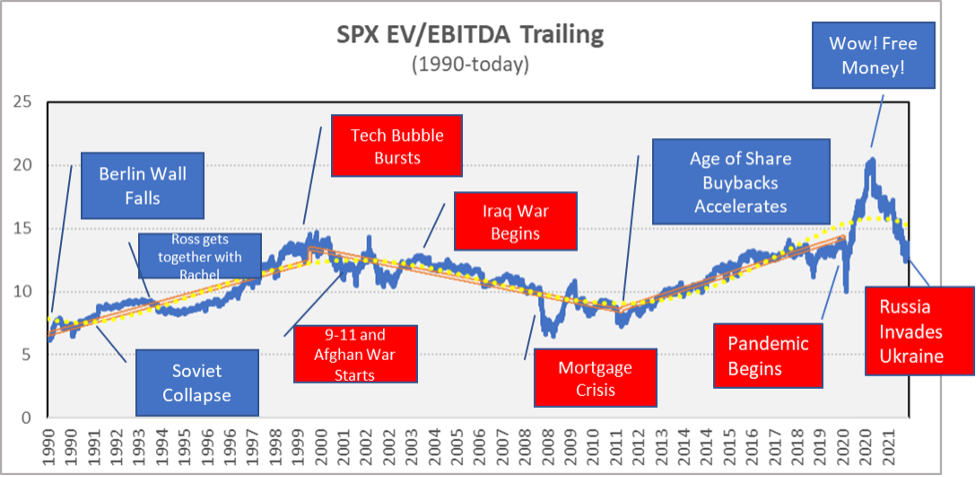
There was a plethora of articles in the early to mid-1990s that made the case for “The New Economy”, a brave new world of longer business cycles and higher corporate profits, driven by a few key factors, which we summarize here:
- Peace Dividend. The end of the Cold War allowed countries to reduce defense spending and improve budgets, particularly in Europe.
- Free Trade. As we discussed earlier, the acceleration of free trade agreements and the integration of China and Russia into the supply chains lowered production, labor, and raw material costs.
- Just-in-Time Inventory. Better technology and the internet have allowed companies to be better at tracking dispersed production; and thus, reduce the amount of inventory that companies kept on hand. This significantly reduced the capital locked up in non-productive storage space (see Target example in the text box).
- Information Economy. The advent of the internet allowed a level of technical sharing that was unprecedented in history. The efficiencies gained from sharing technical know-how spurred economic growth.
- Integration of Enemies. There was a geopolitical theory that bringing Russia and China into the “Rules Based Order” would gradually integrate them to the point where it was too costly to challenge the West. In the case of Central and Eastern Europe, they were directly integrated into the EU and NATO
- Ease of Capital Flows. A corollary to trade integration was making capital flows easier between countries. China became the second largest holder of US treasuries (after Japan), while the US became the biggest foreign investor in China. Cross-border stock market investing became nearly seamless.
- Low Inflation and Interest Rates. The combination of these factors would reduce budget deficits, inflation, and interest rates, which in turn would spur economic growth. For instance, China’s trade surplus with the US required it to buy more US treasuries, which arguably actually increased the dominance of the dollar and helped lower US borrowing costs.
It is easy for markets to dismiss the pandemic as a one-off event and the Ukraine war as nothing more than a regional conflict. Markets have an inertia that makes them try to return to previous norms as quickly as possible. But let’s look at what has likely changed more fundamentally to the order we described above:
- Russia and China were Mean Girls Just Pretending to be our Friends. The belief that economic integration through global trading would make conflicts too costly has run up against a hard dose of reality. Putin has been saying for more than a decade that the West is an enemy and that authoritarian, “illiberal democracy” is the future of the world order. Russia has been willing to cut energy supplies to the West despite the loss in revenues, while the West has proven itself willing to sanction Russia even at the expense of Western economic growth and inflation.
- China-Taiwan Conflict Waiting in the Wings. China’s “President for Life” Xi Jinping does not disagree with Putin. From a geopolitical perspective, Mr. Xi would have liked another decade or so of notional cooperation with the West before it brought on this level of Cold War tension. Yet Wall Street often assumed that Mr. Xi was a capitalist at heart and a communist in name only. It turns out it is actually the reverse. China has been content to use the West to grow its economy, but it never saw this as a long-term integration story into the Rules Based Economy. China was content to game the system, cheat where it could, and give just enough to make itself look cooperative, all in a process of building up its economy and military. Its territorial ambitions are no secret, and Taiwan is squarely in its crosshairs.
- Free Trade is On Life Support. The free trade order was already struggling, as was made clear in the previous US president’s trade wars and tinkering with NAFTA. The strains on the working class caused by free trade have been onerous, but it has had a strong disinflationary effect (goods have become cheaper). It is far from clear in this post-pandemic, Cold War II environment that free trade survives in its current incarnation. It is far likelier that regional blocs become the norm, and this will likely have cost implications. Even if you doubt that the world’s free trade regime will come crashing down, China’s authoritarian approach to economic policy (think draconian COVID lockdowns) has caused a lot of companies to reassess how much they can rely on unhindered trade flows and stretched supply chains.
- The Opposite of a Peace Dividend. If the end of the Cold War began an age of lower defense budgets and lower interest rates, could we be in store for something of a partial reversal of this process? The US expenditures on weapons for Ukraine have been significant to date, but paltry in comparison to our massive defense budget. But you need look no further than the EU countries to see how the peace dividend is reversing, and countries are again having to ramp up their spending to bolster a revanchist Russia (say that ten times fast, then look it up). It is worth reminding ourselves that the addition of neutral Finland and Sweden into NATO would have been unfathomable just a year ago, but now it is adding 800 more miles of NATO border with Russia and significantly more coastline. We are witnessing a fundamental geopolitical shift.
- Constraints to Capital Flows. In a bid to make China live up to its commitments of transparency in the Rules Based Economy, the SEC has been moving to de-list certain Chinese companies from US markets. Effectively they are saying “no more easy capital-raising for you, Mr. Xi, until you play ball according to baseball rules.” Xi had been throwing spitballs. Now, Russia has been all but cut off from most foreign investment and can’t even pay its US-dollar bonds. What gets less attention is that these disruptions to capital flows and trade also have knock-on effects in countries that have nothing to do with these conflicts (think grain shortages in Africa, etc.). The cutting off of foreign investment in one part of the world can put a chill on all foreign investment.
- Long-Term Inflation Pressures. During the pandemic, it was fair to say that inflation was likely to be transitory, if perhaps in need of a tighter Fed policy. Now, however, Russia has added inflation pressures that are likely to be stickier even with Fed rate increases. Most notably, price pressures will remain for energy, grain, metals, minerals, most raw materials, steel, aluminum, etc. Trade flows will generally be disrupted, making shipping more remote and thus costlier. That’s inflationary and not very responsive to interest rate changes.
- ‘On-Shoring’ is Accelerating. If the last three decades were the age of ‘off-shoring’ (sending parts of your supply chain overseas), the post-pandemic, post-Ukraine world is partially reversing that trend. This is not only because of the vulnerability of companies to supply disruptions in their stretched supply chain, it is also part of a growing security concern. The CHIPS act in the US was designed to spur re-development of US microchip manufacturing to reduce reliance on Taiwan (which is seen as vulnerable to Chinese security issues). The EU, and Germany in particular, are spurring costlier sources of energy production and importation, such as the building of LNG ports to avoid relying on Russian gas. But a far more sweeping change is happening to many companies who now realize after war and epidemic that their supply chains need to be reoriented so that they are less prone to disruption.
- Information Flows are Tightening. The US government no longer trusts Russia or China. That is part of why we are delisting Chinese companies. China wants access to US knowhow, which it forces foreign companies to share as the price of entry to the Chinese market.
- Larding up the Larder. The shortages of the pandemic also made it clear to many companies that their inventories had become way too thin. While more resilient supply chains could help with some of the shortfalls, many companies are reassessing whether they also just need to keep more of their products and raw materials on hand to weather any disruptions. This costs money and ties up capital, which ultimately puts upward pressure on interest rates and inflation.
- Climate Pressures. It is hard to see a scenario in which climate change and/or the expansion of green energy does not add inflationary pressure. More extreme weather events will significantly add to government expenditure and insurance costs, while green energy and electric vehicle expansion will initially be more costly (though it will reduce cost variability and exposure to geopolitical shocks in the long term).
- A Less than All-Mighty Dollar. The death of the dollar as the preeminent currency has been predicted so many times in the last 30 years that it has become something of a running joke. The dollar has been the safe-haven currency through every crisis in large part because the US government has a very liquid debt market. There’s nowhere else an investor can move money so quickly without moving the market too much. But let’s not forget that decades of trade surpluses between China and the US have meant a growing store of US treasury bonds are held by China — close to $1 trillion. There has always been the assumption that China would not cut off its nose to spite its face — i.e., dumping US treasuries in an attempt to put pressure on the US government by pushing up interest rates or precipitating a financial crisis; but in a Cold War environment, that assumption may not hold up.
Are we therefore poised for a decade or two of declining stock valuations and lower-than-average stock market returns in the face of these geopolitical changes? Here at Sulzberger Capital, we would rate this an unequivocal “maybe”. When you are dealing with so many economic, technological, and geopolitical factors, an analyst would be incredibly irresponsible to make absolutist predictions (mind you, that doesn’t seem to stop a lot of Wall Street strategists). We are seeing hints of this already happening (see Target box).
What we can say definitively is that valuations have reached historically high levels, and interest rates are most definitely going to go up to combat inflation. Inventories are building.
The elements are certainly there for declining valuations, but the outcome depends on many economic factors, some of which may counter this trend. We are living in a very different economy than the one that we had at the beginning of the 1990s. Technological innovations, information flows, and automation make companies quicker to adjust to changes in their business environment. If we were to hazard a guess, there is perhaps a 40-50% probability of this declining valuation scenario.
What Does This Mean for Managing Your Portfolio?
That leads us to the question “what should investors do to protect themselves from a secular decline in equity valuations, even if there’s less than a 50% chance of it occurring?” One reasonable response could be “nothing”, because declining valuations do not mean equity won’t provide reasonable returns — just that they could be lower than you were forecasting to achieve your goals.
Another point to make is that this scenario is like playing against a poker player with a pretty visible tell. The possibility of a lower return scenario that we described hinges on rising corporate bond yields over time, and that will tend to be a leading indicator that you can see with your own eyes — if you are watching for it amidst the statistical noise.
Figure 5
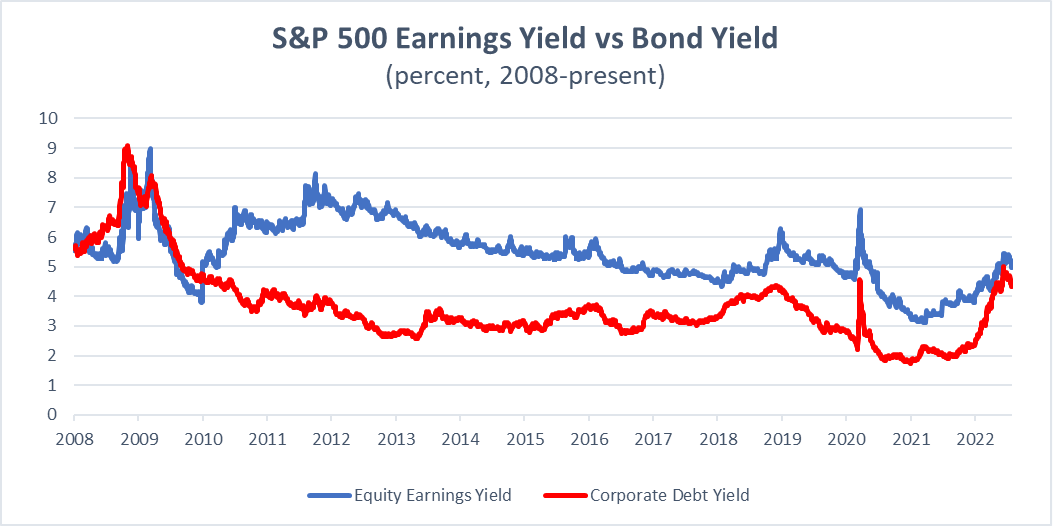
Figure 5 is another way of looking at these valuations by breaking out the yields (earnings) on stocks and corporate bond yields since 2008. Said another way, the chart parses out the amount of companies’ earnings that is attributed to stocks and how much is attributed to their bonds. It is pretty clear that bond yields are closing in on stock yields, which actually could make the relative attractiveness of corporate bond yields better than at any time since 2008. If that relationship holds or bonds begin to outpace stock earnings, there is a good chance that the forces we are describing may begin to bring stock valuations down.
The good news is that you can still get returns from the growth of companies, but more of that might become allocated to bond yields. When you invest in corporate bonds, you pretty much know what you are getting if you hold it to maturity — so the risk adjusted yield can be attractive as interest rates rise.
An important point here is that stock yields also increased in 2008 simultaneously with bonds, but you would have had to catch the bottom of the market to benefit from them. Most investors are not good at catching this bottom at the moment when economic conditions look most dire.
Whether you do more than nothing and what kind of response your manager might fashion depends critically on the type of risk profile you have in your portfolio and your time horizon. For instance, if you keep a classic 60:40 portfolio (60% equity and 40% bonds) and you expect to be regularly taking money from the portfolio over the next decade, then this might be a risk that could eat into your expected returns. If your advisor thinks it is appropriate for your circumstances, you could increase your corporate bond allocations as yields increase (maybe to 50:50 equity to bonds). You could consider adding other asset classes that are not highly correlated to equity returns or whose returns are less dependent on expensive valuations continuing (e.g., private equity, real estate, absolute return funds).
Your manager also needs to take into account the type of accounts you have and whether any tweaks to allocation makes sense based on your tax situation. For instance, IRAs and other tax-deferred accounts can do investment switching without tax consequences. If you want to gradually increase your allocation to bonds as you get nearer to retirement (a common strategy regardless), then it may make sense to do those changes in your tax-deferred accounts rather than taxable accounts. Bear in mind that bond interest is taxed at a higher rate than capital gains (as regular income). In an IRA, that doesn’t matter, but in a taxable account, you should bear that in mind and consult with your tax advisor.
If you are 100% in stocks and have a time horizon of a couple decades before you need the money (say, retire), it might not make sense to tweak your allocations. Over a long time-horizon, it is more likely that an equity portfolio will realize higher returns than bonds, even if valuations are falling. You just may need to weather one or two sharp downturns in the interim.
It is important to stress that every person’s investment risk profile and time horizon is unique, so talk to your advisor about any allocation concerns.
1 Note that equity prices can go up even as valuations are declining, so falling valuations do not necessarily equate to negative returns. They would likely equate to moderating returns over a longer period of time.
2 Unless otherwise noted, all data in this white paper are taken from Bloomberg data sources. EV/EBITDA ratio is based on trailing (historical) EBITDA for the aggregate SPX companies.
3 There is some overlap in the elements of this chart that create a bit of auto-correlation. The valuation ratio we are using includes all of a company’s capital, inclusive of corporate debt, and this means that the effects of debt yields are embedded in the largest input to the enterprise value.
4 It is important to note that the Fed is not the only factor in controlling inflation. The Fed may ultimately have to slam the brakes harder to cool the economy and take the pressure off supply chains in order to curtail inflation.
- Sulzberger Capital Advisors, Inc. is registered as an investment advisor with the state of Florida. The firm only transacts business in states where it is properly registered, or is excluded or exempted from registration requirements. Registration as an investment advisor does not constitute an endorsement of the firm by securities regulators nor does it indicate that the advisor has attained a particular level of skill or ability.
- This white paper should not be construed as personalized investment advice or as an offer to buy or sell the securities mentioned herein. A professional advisor should be consulted before implementing any of the strategies presented. All investments and investment strategies have the potential for profit or loss.
- Different types of investments involve varying degrees of risk, and there can be no assurance that any specific investment or strategy will be suitable or profitable for a client’s portfolio. Asset allocation and diversification do not ensure or guarantee better performance and cannot eliminate the risk of investment losses.
- Investments in bonds are subject to liquidity risk, market risk, interest rate risk, credit risk, inflation risk, purchasing power risk, and taxation risk.
- Historical performance results for investment indexes and/or categories, generally do not reflect the deduction of transaction and/or custodial charges or the deduction of an investment-management fee, the incurrence of which would have the effect of decreasing historical performance results. Returns do not represent the performance of Sulzberger Capital Advisors, Inc. or any of its advisory clients. There are no assurances that a client’s portfolio will match or outperform any particular benchmark.