A Look-Back at 2020: The Fed’s Precedent-Setting Pandemic Playbook
There is a long-standing practice amongst money managers and investment advisors to send out an annual letter to clients. These are generally infinitely forgettable affairs, and mostly backward looking. So, in this year's letter we wanted to give people just one number to remember the year in financial terms: 14.
- 14% of U.S. GDP was spent on direct economic stimulus (Source: Goldman Sachs);
- 14% was the savings rate in the US, which compares to a savings rate which is usually in the low single digits or even negative (Source: Goldman Sachs); and
- 14 is the ratio of the current enterprise value relative to the forecast of earnings before interest, tax, and depreciation (EV/EBITDA) for the S&P 500 stock index looking 2 years forward. This is a widely-used metric of the price of stocks relative to their total earnings controlling for how much debt they have. The average is around 10, meaning the stock market is about 40% more expensive than it has been on average.
The number 14 is coincidental to all of these indicators, but they all share a common root, which is the pandemic and its economic impact. Taken together, though, they tell an interesting and often counterintuitive story. Many stock indexes have gone up at a higher rate than average even as the earnings of companies have fallen amidst the pandemic and U.S. GDP has plummeted the most since the Great Depression. World GDP fell about 4% -- which is a lot by world standards. This is the first time in history that the S&P 500 ended in positive territory during a severe recession. Stocks are even more expensive in terms of their price relative to earnings than they were at any time in history including at the height of the dot.com bubble.
Does that mean the stock market will fall? Not necessarily. Americans are spending less on services and therefore have more money to save and invest in stocks. Even more importantly, there is just a whole lot of newly created money from the Fed chasing the same number of stocks. It is simply supply and demand. If there is a lot of money in the system, things tend to get more expensive.
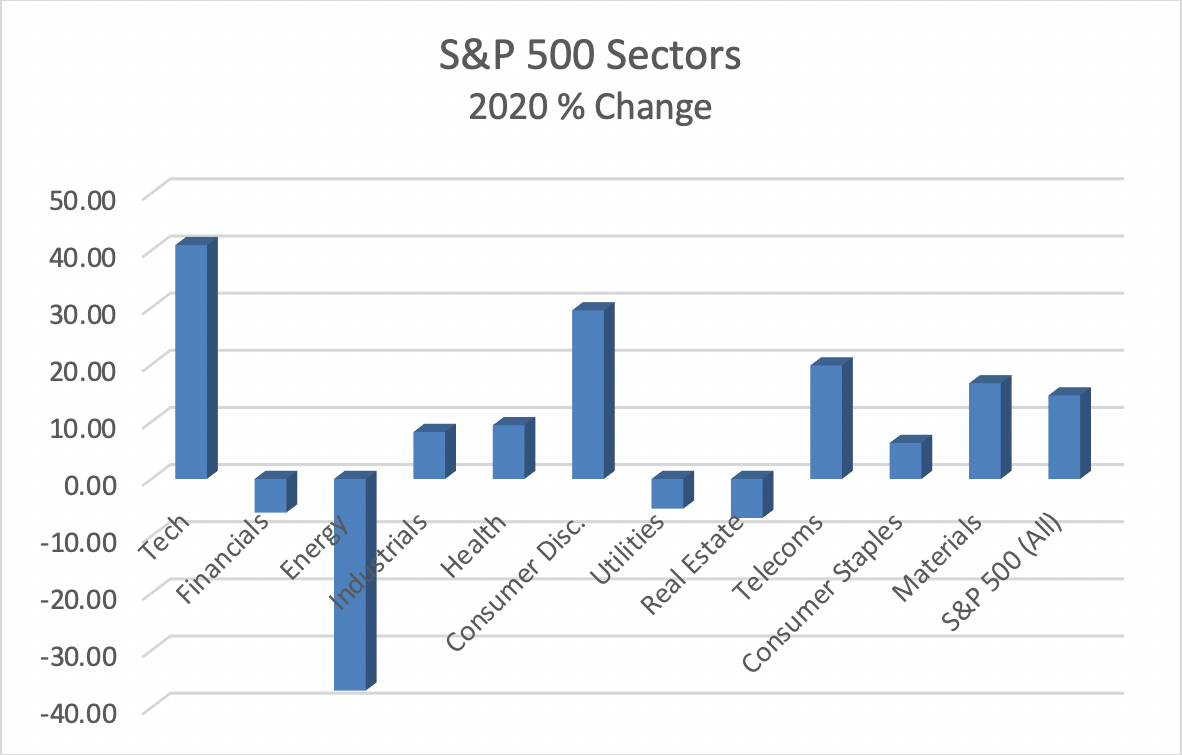
The graph below captures much of the uneven performance of different sectors of the S&P 500 companies through 2020. Of particular note here, the Tech sector rose by a staggering 41% whereas the Energy sector fell by 37%. The Tech sector shot up in large part because of investors seeking shelter in companies that were resilient in the face of the pandemic (think Google, Amazon, Netflix, etc.). This in itself is a good indication of the Fed’s indirect influence, as the very idea of ‘seeking shelter’ in normally high-risk Tech stocks is almost diametrically opposed to past recessions. The Energy sector was pushed lower mostly due to oil companies’ struggles as demand for oil fell worldwide. The Financial sector was down a comparatively modest 6%, held back in the face of concerns about delinquent loans due to the recession. Of course, that’s an issue with loans to brick-and-mortar service industries, but retail sales actually grew overall (believe it or not). Consumer Discretionary goods sector rose by a very considerable 29.5% (led by Amazon), while Telecoms notched a nearly 20% increase with the increase in remote work. (The figures in this paragraph and throughout this article, unless otherwise stated, were sourced from Bloomberg.)
The Fed’s hand was indirectly behind much of the growth in the positive sectors, even propping up the banking sector to help it recover some of its losses. The typical investor is somewhat mystified by how the Federal Reserve has ‘injected’ money into the economy through bond purchases, so we are going to take a minute to focus on the Fed’s creation of money and its impact on stock market valuations.
To understand this effect, consider a fund manager who has a portfolio that is 50% stocks and 50% in bonds (say, a mix of corporate and treasury bonds). After an initial sharp fall in the value of both during March, the Federal Reserve intervenes aggressively to buy bonds (which helps lower interest rates). The way it does this is:
- Three people in a windowless room (literally) at the Fed get on computer screens and buy specific bonds that have been targeted.
- To pay for them, they just create a transfer from the Federal Reserve Bank, which, through the magic of modern finance, is just the Federal Reserve declaring that it has the money. Somewhere along the way, someone makes an accounting entry to reflect the ‘increase in capital’, and voila!, there is $4-5 trillion in electronically created money.
Yet this is only the beginning of the process. If you are that fund manager with the ailing portfolio, all of a sudden the Fed’s aggressive buying raises the prices of all of its bonds. Indeed, the prices rise so rapidly that the bond portion sees the equivalent of several years of normal returns practically overnight. There is one challenge, though. After the prices rise so much, the expected returns for many years going forward are as little as 0.6% per annum: not exactly the stuff of legendary managers. Therefore, the manager decides to sell a load of bonds (which maybe the Fed buys) and uses the money to buy more stocks. Then multiply this by many funds, and stock prices are pushing higher and higher. The lower the yield on the bonds, the more willing managers may become to accept lower returns from stocks even at high valuations.
There is a common adage that the Fed’s job is to take away the punch bowl just as the party really gets started. In 2020, the Fed essentially said it would just keep filling the punch bowl until everyone got too bombed to notice the pandemic around them. A prudent investor should absolutely have been lowering risk by reducing exposure to equity until there was a clearer understanding of the pandemic’s effects – indeed, that’s what the so-called ‘smart money’ was doing. But the Fed’s experience from 2008 seems to have taught it that prudence was bad for the economy. So it was better to throw so much money out there that you would begin to punish those impudent prudes and force them into stocks. We knew that the Federal Reserve was trying to stabilize markets by buying bonds (and some funds), but it was hard to believe what a massive undertaking this was going to be. To put this in perspective, The Federal Reserve injected more money into the U.S. economy during the first three months of this crisis than it did during the first three years of the 2008 Financial crisis. The sheer magnitude of this is breathtaking (OK, it is blasé now, but that’s just because we are incredibly quick at accepting a new normal).
The period between March through the end of April was one of the strangest and most fraught periods for markets in modern history, making the 2008 crisis seem almost normal. From its peak on February 19, the S&P 500 fell almost 34% as the pandemic began to panic investors. It then recovered at a record pace relative to past crises and notched pretty good returns even relative to a normal year (at least in the US). However, this was overwhelmingly skewed by Tech stocks because of the weird ‘sheltering’ in stocks that were ostensibly pandemic-resilient. Just five Big Tech stocks – Facebook, Amazon, Google, Microsoft, and Apple – accounted for one third of the increase in the S&P 500 index.
In his 2020 “Year in Review” column, Dave Barry captures the sheer chaos of the March-April pandemic period with a page-long, run-on sentence, the economic part of which read as follows:
“are we flattening the curve yet Dr. Fauci Dr. Birx because we’re in a recession no wait maybe it’s a depression look at the unemployment numbers we are never going to recover from this if the virus doesn’t kill us we will starve to death we need more money from the government we need billions no we need trillions no we need MORE trillions where is this money coming from we have to open the economy up but if we do WE WILL ALL DIE hey I found some toilet paper”
We include this choice quotation because, in the pandemic aftermath, the narrative that gets written about market movements looks much more like a sure-footed, straight path to recovery than how the crazy two-month period actually unfolded. While the Federal Reserve can put a lot of spiked punch in the horse’s trough, it can't make him drink the Kool-Aid (or pick better mixed metaphors). In other words, while the eventual recovery of financial markets was largely a product of the buoyancy that the Fed provided in the form of new money, the actual process of buying stocks by managers was much less certain. So with a nod to Dave Barry, here’s a stab at recalling how financial professionals wrote about the market risks and opportunities in March and April:
“have we hit market bottom yet because I see the curve for New York COVID deaths starting to peak, and that’s all we really care about because we ignored the pandemic until it got to Wall Street but HOLY S#$@ we better cover these short positions because Florida is opening up beaches and the Fed just injected about enough money to buy Australia but the market is going to have to rise some and WOW it’s a ‘tradable rally’, even though it will be a ‘bear-market rally’ and after all, stocks will recover eventually, so you might as well buy them now, and besides the discount rate for equity is lower because the Fed is going to hold interest rates at near zero until my kids have grandchildren, but quick, let’s pile into Big Tech stocks because they can withstand the pandemic except now they are getting too expensive so everyone who missed out better buy the stuff that didn’t recover yet really anywhere but in bonds since no one really wants to make 0.001% for the next millennium or two, oh, and what’s that shiny object WHAT? more IPOs better buy them too, but come on, Jack, there’s an election in the US, so maybe we should just buy Australia…
Underpinning all of this chaos was just a lot of money chasing too few assets. The narrative around it was generally just the spark that set off specific rallies, or, more typically, just a post facto justification for where prices ended up. We should note that it really doesn't take that much buying of stocks to have a fairly dramatic impact on the reported price of equity. In any given day, only a tiny fraction of the total market value of stocks and bonds is actually bought and sold, but this forms the basis for the reported market prices, and thus the investment balances for millions of people. So who were these intrepid buyers who actually moved the markets during March and April. It may surprise people to learn that they were not the Warren Buffets and high-net-worth investors, who largely avoided increasing exposure to stock after the initial fall and were actually net sellers. Instead, the initial Fed-pushed recovery came from an array of other players, including:
- Short Sellers. These are specialized investors like hedge funds who bet against the market. When the Fed money came in, they had to cover their bets by buying back stocks. At one point in April, nearly 80% of all stock buying was being done by short-sellers getting out of their short positions. As Jay Powell aptly said in May: “you wouldn't want to bet against the American economy.” Score one for the Fed;
- Investment Banks. The next wave of buyers came from investment banks who were pessimistic about stocks overall but felt like a lot of stocks had fallen too far (providing an opportunity for a ‘tradable rally’);
- Active Managers. Another source of buyers came from so called actively managed funds, which, unlike index funds, can choose individual stocks that they think will outperform. In 2020, humans actually beat computers in stock picking for the first time in a decade. Yet buying Amazon in April and May was actually a defensive move. At first, most were trying to swap out of stocks that were more likely to be exposed to pandemic risk; and
- Option Day Traders. Another unexpected force within markets during the early months of the pandemic were newly home-bound day traders who discovered options. We won’t bore you here with the reason why option buying led to an accumulation of stocks within banks. Suffice it to say that banks act as go-betweens for the trading of options, and a lot of short-term speculation in options actually forced the purchase of the underlying stocks by banks to hedge their risk of being caught short.
So, while most investors were lowering the total risk of their portfolios in anticipation of a serious recession and a potentially contested election, a comparatively small volume of traders moved much of the stock market back up -- and then some – often for defensive reasons. By May, there was something of a fear-of-missing-out rally, but the generally upward trajectory of markets meant that the Fed had largely succeeded in stabilizing prices and the so-called wealth effect (the sense of wealth that comes from unrealized portfolio gains on paper). This in turn had some positive impact on the economy, at least for the wealthier half of the population.
Is this a brave new world of consequence-free money creation?
So the key question that arises from this Fed-inspired rally is how does this change the investment landscape, if at all? In answering this, we feel a bit like a pollster burned by the 2016 election: we can tell you what the numbers say, but there is a big uncertainty that accompanies those numbers. That said, there has been a fundamental shift in monetary policy that will have implications for decades to come. Whereas after the 2008 crisis, we discovered that the Fed could inject trillions of dollars into the money supply without sparking inflation, in 2020 we learned that if the Fed does this very quickly, it can largely erase any negative impact on financial markets. Fifty years of economics and finance theory essentially had to be fundamentally revised. From an investment perspective, such a revision has some consequential implications:
Lower Average Stock Returns. Stock market annual returns will likely decline from an average of about 9% historically to around 6% for about a decade. This is a less bold prediction than it may seem on the surface. It is notoriously hard to predict stock market movements over a short period of time or even over a few years. However, long term, its average is fairly consistent. The recent run-up in prices at the same time that earnings were falling effectively means that we have borrowed on future price increases to pay for near-term recovery. You can have above average returns when the economy is in a strong growth phase, but you cannot sustain stock price increases for very long when earnings growth is negative or slow. Eventually – maybe not immediately, mind you – stock price increases will at least have to slow, if not reverse, in order for corporate earnings to catch up. It may seem quaint to say, but there is a long-term relationship between the profits that companies make and their stock price, and that equilibrium will have to be reset sooner or later (see text box).
All of that said, in the short term, the price of equity is whatever people are willing to pay for it, and there is a lot of money still sitting on the sidelines in cash. We are not saying that the market couldn’t go up another 14% next year: just that it is more likely to have lower-than-average returns over the next decade or so.
What’s a Discount Rate, and Do I Really Care?
At the risk of getting a bit too technical, share prices are based on a discount rate that is essentially like an expected interest rate for owning stocks, but used in reverse. It consists of a risk-free bond rate, usually linked to U.S. short-term treasury bonds, and a risk premium over bonds that has all sorts of complicated inputs. But if you look no further than that first input, the short-term U.S. Treasury yields were pushed down by the Fed from something approaching 2% to practically zero almost overnight. Due only to that change, the expected return on stocks would therefore also drop by 2% (i.e., that alone would account for a fall from a 9% average return to about 7%). On top of this, the Federal Reserve has now made it fairly clear that it has your back (the so-called “Fed put option”), which lowers the second input (risk premium). If the Fed can push asset prices up in the midst of the worst economic crisis since the Great Depression, then the expectations for equity risk will certainly be revised downwards in expectation of the Fed intervening that hard in all crises.
The Fed has no way to avoid doubling down on moral hazards. Lots has been written recently about the ‘moral hazard’ of bailing out an entire economy. The concept of moral hazard is that lots of companies who took on far too much debt or risk when the economy was doing well had to be bailed out with access to cheap debt as part of the Fed’s response to the pandemic. Leaving aside the morality part, there is absolutely a hazard that the Fed has made it clear to markets that there is not really a penalty for taking excessive risk – i.e., borrowing to grow faster or pay your shareholders profits. Indeed, eventually all companies will have to take higher levels of risk and borrowing or face the prospect of underperforming all the other companies that do take that level of risk. We already saw this in the aftermath of the 2008 financial crisis. The bailout of many of the worst offenders due to systemic risks did send a clear message that there wouldn’t be a serious price to pay for taking on too much debt, thus leading to even more borrowing. The decade that followed was marked by a substantial increase in borrowing by companies to purchase their own stocks in an effort to push up their prices and thus the stock option packages of their management teams.
Yet the Fed has no easy way to extricate itself from this arms race of risk-taking. The fact that the Fed was willing to create so much money so quickly to back asset prices means that it has something of a sunk cost that it may have to protect at any cost. Now that the Fed has shown itself willing to intervene with so much fire power, there is now going to be the expectation that the Fed will intervene at any hint of crisis or else risk undermining its authority to move financial markets. There is a catch 22 here: we all have so much faith that the Fed will save us, that we are willing to take on a lot more risk. This in turn makes it more likely that there are systemic crises in the future which will require the Fed to intervene.
The level of risk in typical investment portfolios will also likely increase. A corollary to the projection of lower stock market returns over the next decade is the likely outcome in which many investors increase the risk profile of their portfolios to try to achieve similar returns to the past even as equity returns are projected to lag that. If you are running a foundation that typically pays out 5-6% per year to its beneficiaries, you are no longer going to be able to get the same level of return from your assets as you did before. The 60% equity and 40% debt portfolio that you had for years will not yield the expected returns. Risk can be increased through a lot of means to boost returns: e.g., shift the percentage of stocks in a portfolio higher or weight it more toward Tech, borrow some money to buy assets, increase allocations to alternative assets like private equity, real estate, and emerging markets. These are not strategies that would be common for most individual investors, but they have their place in some well diversified portfolios. But typical retail investors do not have access to a lot of these possibilities because most of their savings are concentrated in 401ks and 529s that have a limited selection of investment choices. It should be stressed that many investors will just resign themselves to the possibility of lower returns in the medium term without fundamentally changing their allocation strategy.
A continuing ‘leakage’ of U.S. money to alternative markets
When the Fed created so much money so quickly and pumped it into financial markets, the initial effect was almost entirely US-centric. There are a variety of reasons for this – such as funds being restricted to U.S. assets, inertia, tax impacts, etc. Yet once a lot of managers saw the U.S. market recover and start to get very expensive relative to earnings, investors started to shift some funds into other markets or sectors that were fairly priced. In the US, this took the form of shifting some funds from Tech into sectors like banking that had been beaten down by the pandemic’s impact. There was generally not a lot of shift in the underlying fundamentals for these companies – just an understanding that there was a lot of money out there that was going to continue to pour back into markets. A similar exodus of excess U.S. money occurred starting from the summer when traders began to buy up stocks in foreign markets that were considered more pandemic-resilient: e.g., Japan, Korea, China, etc. Europe likewise started to recover toward the end of the summer, albeit it is still the one major developed market that has not fully recovered. There may be some more upward momentum in Europe, particularly as the full implications of Brexit will now become clear following the EU-UK trade deal.
Inflation will eventually return, but it may take a few years
A peculiarity of this increase in the money supply is that unlike past recessions, this has been concentrated overwhelmingly amongst wealthier Americans. This is why we have seen significant ‘asset inflation’ even while retail prices have remained fairly muted. Traditionally, the Fed has watched retail inflation as one of their primary metrics, raising interest rates and reducing the money supply when inflation begins to creep up. But after their experiences with the long, slow recovery after the 2008 crisis, the Fed announced over the summer that they would now accept an ‘overshooting’ of inflation targets to achieve their inflation targets on an average basis. In effect, this means the Fed is signaling that it will keep interest rates low for a longer period, which in turn meant that stock prices could continue to rise more to reflect that lower discount rate.
Increase in Home Prices around Urban Markets
Retail real estate took a real beating in 2020 as street-level services lost foot traffic. Yet home prices got a boost in big markets, ostensibly as urban apartment dwellers sought more space so they could work from home without their kids driving them fully insane. While arguably the latter was a factor, this is really the Fed’s not-so-invisible hand once again at work. It pushed mortgage rates to record lows (through Fed rates to banks and bond buying), as well as the effects of wealth recovery. But again, there is roughly $5 trillion more of money in the money supply than there was before the pandemic, and this has to go somewhere. In effect, this means home buyers can put bigger down payments down on houses and get better mortgage rates to afford more. This spurs demand and increases in the prices of homes. The Fed has to watch how much speculation goes into this buying spree, as things didn’t turn out so well in the housing bubble running up to 2008.
Even more wealth inequality
Creating money to stimulate the economy has its limitations, as Fed Chair Jay Powell has repeatedly emphasized to Congress. Even before the pandemic, wealth inequality had become a growing concern by policymakers at the Fed. But COVID forced the Fed to exacerbate this wealth gap. The money that the Fed creates in this case goes overwhelmingly to the people who already have significant wealth, while spending that Congress does on stimulus goes more to the ordinary wage-earners. Fed money creation was at a ratio of 2-3 times that of government stimulus spending. By contrast, the amount of total stimulus in the Japanese economy was the inverse of this: the Japanese government spent about twice as much on stimulus as their central bank did on new money creation.
Anyone who already had significant investment portfolios saw those recover and then grow. When you couple that with the fact that upper income professionals have mostly been able to keep their jobs and work from home while lower income individuals were struggling with job losses, you can see the significant effects in exacerbating the wealth gap. There have really been two economies: one that has done moderately well for half the population and one that has done poorly for the other half. Since we're all stuck in our homes most of the time, we don't generally get to see how the other half lives.
In the likely event that stock market returns will be lower on an average basis over the next decade, the younger generation of savers will tend to lag behind in building their wealth, as they will be putting money into 401ks that don’t grow as much. The only plausible way this would not be true is if there was a large market correction that brought stock prices back to less expensive levels relative to corporate earnings followed by a more normal growth (i.e., more new 401k and IRA contributions would be invested at better pricing). Yet, we don’t think the Fed can allow such a correction anytime soon, because that could undermine all the success it has had up to now. It may have to tolerate the fact that a generation of wealthier people will have more money to pass on to their children, whereas college graduates without wealthy parents will not be able to grow their wealth as easily to catch up – even with high salaries.
Concluding Thoughts
There remains the thorny question of how and when does the Fed begin to take this created money back out of the economy. By 2018, the Fed had only just been able to take the money out of the economy from the 2008 crisis – i.e., a full decade later – so it is likely to be a very slow process. Yet there are a lot of implications to the U.S. having injected a lot more money into its economy than elsewhere in the world. That ‘leakage’ of excess money into other markets to buy stocks and bonds may ultimately create a disequilibrium that will force the Fed’s hand sooner than it wants. It will probably increase the U.S. trade deficit (or, more broadly, the current account deficit), and this would ultimately be likely to put downward pressure on the U.S. dollar. That could make holding certain foreign securities more attractive, all other things being equal. But there are a lot of moving parts in this machine.
However, in the near term, there is the possibility that stock prices will continue to push higher, at least in certain sectors, as the economy recovers and the great stores of cash continue to come off of the sidelines. There is still a lot of excess money in cash in high net-worth portfolios in the U.S. As that money comes into financial markets (or gets spent on that deferred driveway resurfacing and kitchen remodeling), the Fed may try to start easing back on the money it created. It basically accomplishes this by making the reverse transaction: selling the bonds on its balance sheet to soak up the excess cash. That is a fine balancing act. The Fed wants to avoid inflation and asset bubbles, but it doesn’t want to ease back before the economy is in full recovery. U.S. unemployment is still around 9% and has been increasing, but the success of distributing vaccines gives us a potential end within sight.
And we hope we can all make a toast to 2021, which hopefully will be a much better year than 2020.
- Sulzberger Capital Advisors, Inc. is registered as an investment advisor with the state of Florida. The firm only transacts business in states where it is properly registered, or is excluded or exempted from registration requirements. Registration as an investment advisor does not constitute an endorsement of the firm by securities regulators nor does it indicate that the advisor has attained a particular level of skill or ability.
- This article should not be construed as personalized investment advice or as an offer to buy or sell the securities mentioned herein. A professional advisor should be consulted before implementing any of the strategies presented. All investments and investment strategies have the potential for profit or loss. Different types of investments involve varying degrees of risk, and there can be no assurance that any specific investment or strategy will be suitable or profitable for a client's investment portfolio. Asset allocation and diversification do not ensure or guarantee better performance and cannot eliminate the risk of investment losses.
- Historical performance results for investment indexes and/or categories, generally do not reflect the deduction of transaction and/or custodial charges or the deduction of an investment-management fee, the incurrence of which would have the effect of decreasing historical performance results. Returns do not represent the performance of Sulzberger Capital Advisors, Inc. or any of its advisory clients. There are no assurances that a client’s portfolio will match or outperform any particular benchmark.