The ABCs of Beta
For this quarter’s note, we thought we would wade a little bit into the turbulent stream of risk measurement known colloquially as Beta. Before everyone shouts in unison “boring!”, give us a chance to make the case that this is a worthwhile topic for investors – or at least for their investment managers.
What is Beta, and do I really care?
We are not going to ask you to dig through your old college notes from the statistics class that you rarely attended because you had far more important partying to do at Beta Upsilon Mu (BUMs rule!). We promise, no formulas in this note.
Most people are pretty familiar with comparing their investment returns to a benchmark stock index such as the S&P 500. It is now a staple of mutual fund performance reports and can be vastly over-used without context. Let’s say the S&P 500 went up 10% in a year, but your portfolio went up 15%, should you celebrate? Sure, but what if you took twice as much risk? In other words, if you only earned 1.5 times the S&P 500 return but took two times the benchmark’s risk, then your portfolio actually underperformed the market benchmark by 5 percentage points. And that’s pretty much Beta in a nutshell.
Beta is a statistical metric that is meant to measure the relative risk – i.e., volatility -- of a portfolio versus a benchmark. If your portfolio Beta is 1.0 against the S&P 500 stock index, this just means that your portfolio is roughly equal in risk to the benchmark, all other things equal (we’ll return to the “all other things equal” a little later, because there is a lot buried in that). A stock or portfolio Beta will not predict its future performance, but it is used as a broad tool to estimate how volatile (risky) or stable your portfolio has been compared to your benchmark.
Why should I care?
We are pretty sure most people are not lying up late at night thinking to themselves “do I have a fat Beta?” But you absolutely could (and maybe should) be asking yourself “is my risk too high?” or “am I not taking enough risk to meet my return objectives?” Beta just becomes shorthand that finance nerds use to measure at least part of a portfolio’s risk relative to its benchmark. We personally think it is much more meaningful as a backward-looking measure of risk than an estimate of future risk, but it absolutely helps to define the risk tolerance and goals of an investor. If you say that you are a 2-Beta kind of guy, that means that you are the sort of person who would be willing to risk taking twice as much of a fall if the market drops in order to try to get twice as much of a return when the market goes up. That’s a lot of risk. Think about when the market fell 32%[1] in March 2020, you would have been down 64%. Could you really have been sleeping well at night knowing that you had potentially lost nearly two thirds of your wealth? If so, you can feast on a double-decker Beta sandwich.
The tricky part of using this measure of risk is that many of us want diversification of our assets to reduce the influence of Beta. Over the last couple of decades, having a portfolio that was 60% in stocks and 40% in bonds was a good way to get ‘absolute returns’. In other words, the movements in the stock and bond benchmarks tended to offset one another in such a way that investors with this portfolio allocation made respectable returns in all kinds of market situations. When the stock market was down, bond prices tended to rally and provided steady income, and vice versa. It was kind of the Oldsmobile of investing: super boring, but reliable.
Starting with the pandemic, however, that calculus shifted quite significantly. When the stock market fell sharply, bond prices did go up in value, providing the kind of diversification that those investors were looking for. Yet once the yields (expected returns) on the bonds fell to really low levels, there was really nowhere for bond prices to go but back down. Why would you want to hold onto 40% of your portfolio in something that was making very little return and would probably lose value over the course of the next couple of years? The 10-year US treasury notes were paying just over 0.6% back in April 2020 and their prices had little room to go but down (bond prices fall as interest rates go up). Risk-averse investors could hold onto that 60:40 portfolio mix, but many people switched to being more highly weighted toward stock holdings starting around the second quarter of 2020. And that’s where it got tricky.
Imagine a world in which a large segment of mom-and-pop investors suddenly start shifting money out of their safe bond investments and into riskier stocks. Then mix that with (1) borrowing costs that were next to nothing, and (2) $4.5 trillion of newly created Fed money. Stir until the market is really frothy. Add a pinch of election volatility and a brimming cup of Reddit-Robinhood day-trading, and bake it for 9-10 months until the market tops get nice and crispy. What emerges from the oven is a piping-hot, market-volatility casserole. Yum. (A summary of the Reddit-Robinhood trading issue can be found at the following CNBC link: GameStop, Reddit and Robinhood: A full recap of the historic retail trading mania on Wall Street (cnbc.com).
Trading, Day-Trading, Technical Trading and SPAC-S#@t-Crazy Trading (a.k.a. whatever this is)
It may seem quaint, but it is probably worth reminding ourselves every so often that the stock market is a form of capital allocation that channels lots of people’s money into companies in order that they can expand and grow to the point where we will eventually have to bow down to Lord Bezos, the Destroyer of small retailers and Bringer of light bulbs to the masses. Strictly speaking, the vast majority of capital that is raised by companies is through the issuance of corporate bonds, a big portion of which is then just recycled into stock buybacks to boost their share prices. Let’s focus for now just on stocks, and more specifically, on the constant tension between trading for short-term profits and investing for the long haul.
Day Trading and Internet hype are not new to stocks, and the Reddit-Robinhood fueled craze is just the latest version of this retail trading expansion that has been going on in different forms for decades. At its most fundamental level, companies raise capital by selling new stock (primary share offer), which is often mistakenly lumped together into the catch-all term of IPO (initial public offering). All other trading is just “secondary” market activity as new investors buy existing shares as other owners sell them. It has a purpose – or so says capitalist orthodoxy – because it helps to set the price of shares for companies when new capital is issued. All the rest is just trading or investment.
When mom and pop investors like us buy stock in a company, we are very rarely getting to participate in a primary issuance of shares. Most stock buying and selling is done of ‘secondary shares’ – i.e., someone already owns shares in that company and another person buys them from him/her/them/it (corporations are people too, damn it!). When we buy stocks as investments, we generally are buying them to hold for multiple years in order to try to grow our money (let’s call that ‘investment’). The main reason that companies increase in value is that they themselves are growing their cash flow and/or they are paying out investors through dividends and stock buybacks. So far, this is all consistent with Finance 101. This is an important point, though. The prices for companies are supposed to be related to their ability to give you back money in one form or another over time, and to do this, most try to grow and expand.
There are two things that make this basic relationship difficult to hold consistently in the short term. One is that it is much more difficult to forecast the long-term earnings for newer companies and ‘growth’ companies. Analysts can disagree quite significantly on their prospects, and this means that the price can move more erratically as buyers try to navigate the differing opinions on a fair price (i.e., volatility). However, layered on top of that is what we can call “The Next Big Thing” trading. Of course, companies want to talk up their stock prices for a variety of reasons, but there is also a cacophony of voices promoting one company or another, sometimes with less-than-noble motives. Finance professionals call this ‘a functioning market’, and you should always listen to the people who brought you the functionality of the 2008 financial crisis (that’s meant as sarcasm).
The last 12 months ushered in another era of Next-Big-Thingism similar to what we had in the late 1990s or in 2006-7. There is a significant increase in the number of retail investors who are not really investors at all, but traders. They are trying to get in and out of stocks on a regular basis to make money on guessing which direction a stock price is going to move, often with little underlying financial analysis to back it. Some of this is natural. Joe Biden’s election was probably a legitimate catalyst for growth in sectors like clean energy, electric vehicles, and certain cyclical recovery stocks. Other things are harder to justify. Don’t even get me started on cryptocurrency or SPACs.
All of this brings me back to Beta. You can’t calculate the Beta on a stock that does not have sufficient trading history (usually a minimum of six months). So, investing in companies that are newly listed – or worse, little more than shell companies – means that you are kind of flying blind. Sometimes it might make sense to invest in a such a company because it is the only reasonable way of putting money into a specific, new area. But invest in them for the long-term, not to make a quick buck.
The Ebbs and Flows of Capital
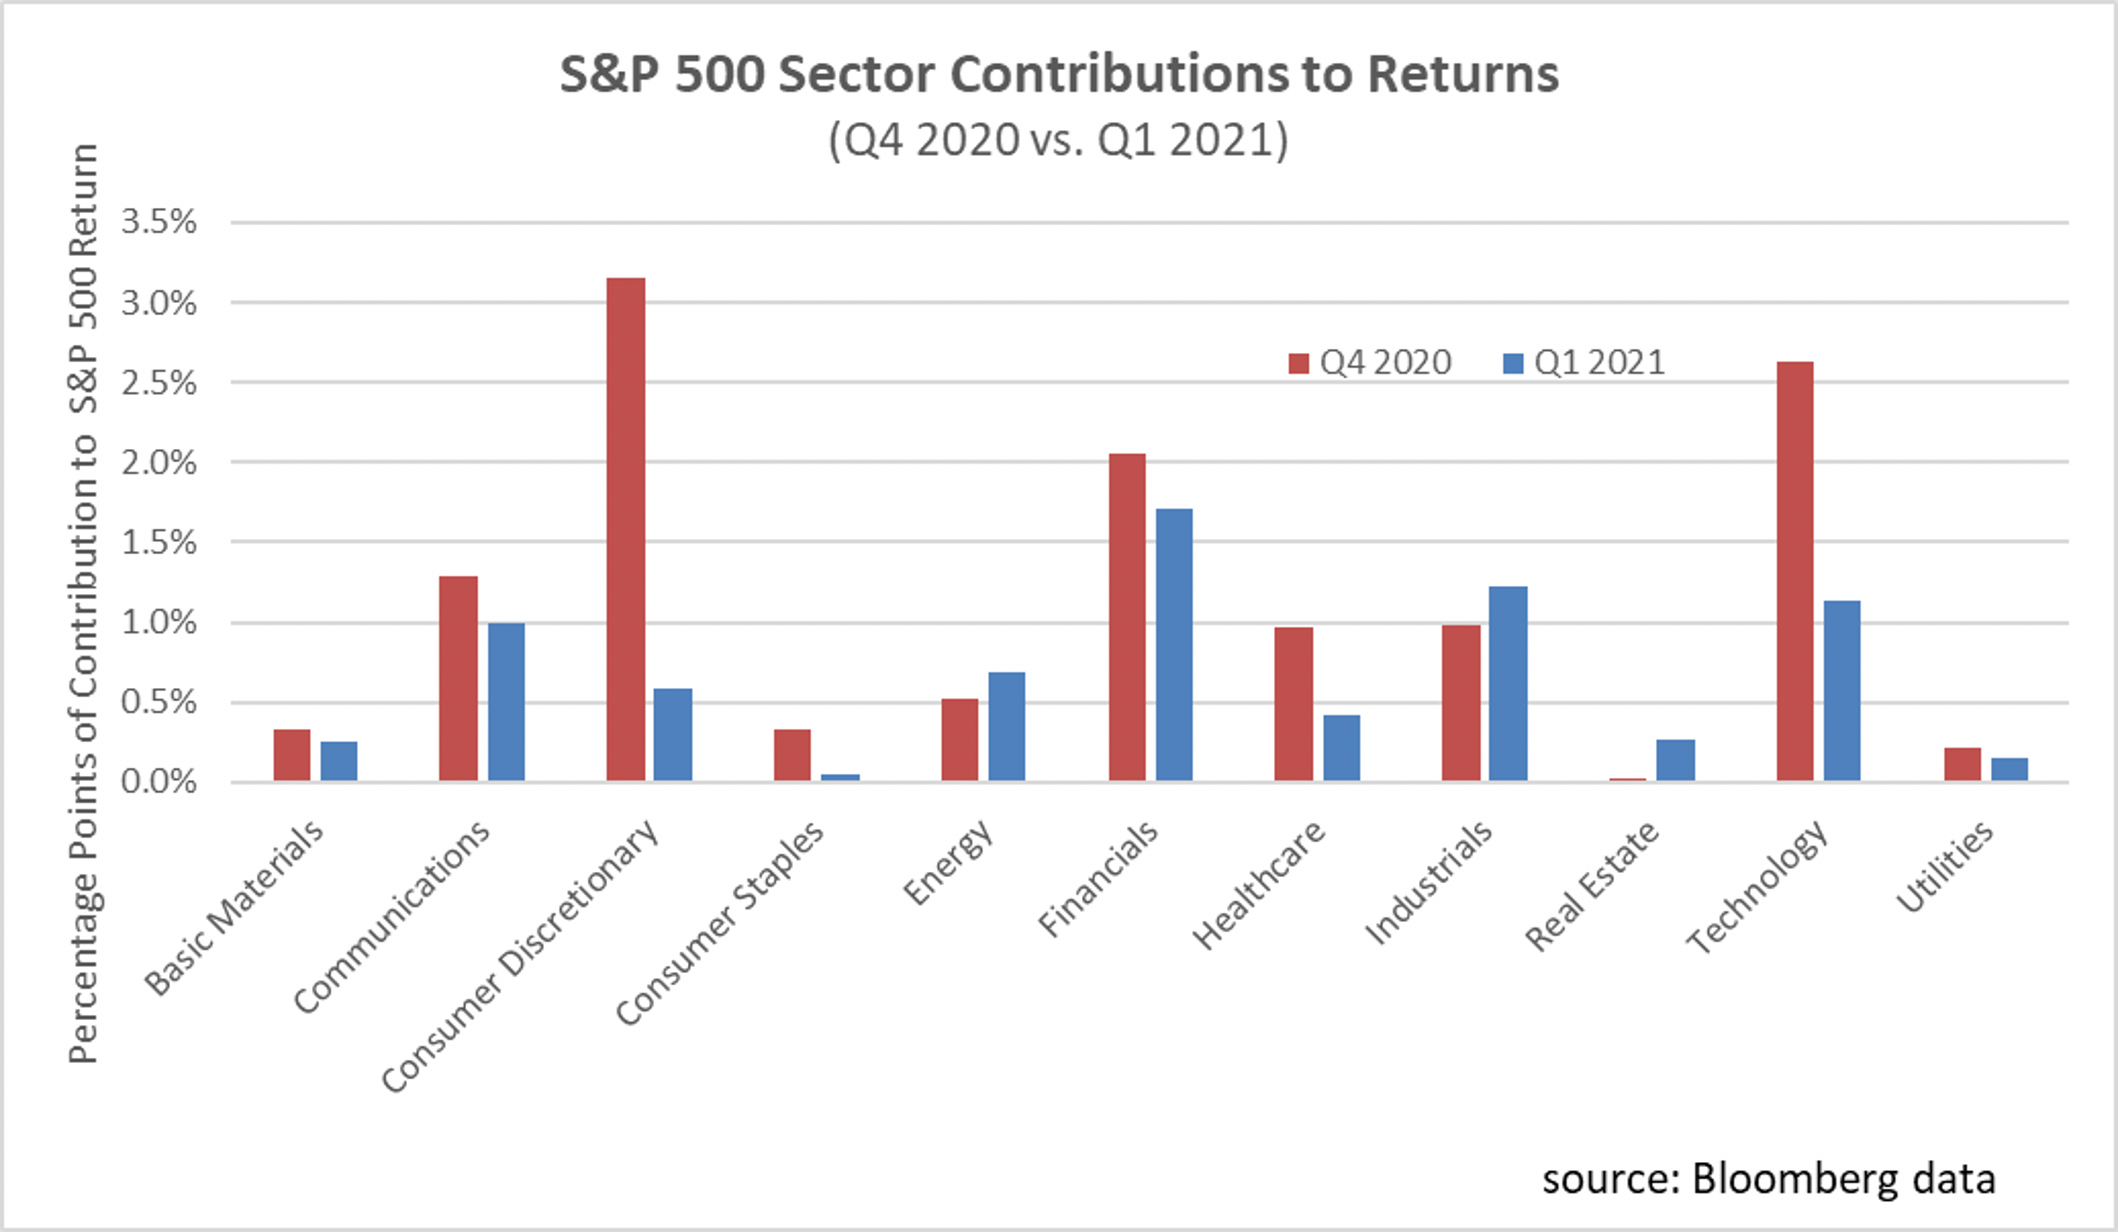
When you break down the contribution of individual sectors to S&P 500 returns, you can see how uneven these contributions were. Chart 1 below shows the percentage points that each sector contributed to the total S&P 500 returns (not the amount the sector increased, but the number of percentage points it added to total S&P 500 returns). It also demonstrates why being overweight in a given sector or stock can be tricky, at least quarter by quarter. The last six months has really been a story of three sectors: Consumer Discretionary, Financials, and Technology. In the aftermath of the March 2020 market drop, Consumer Discretionary stocks suddenly soared -- led by Amazon -- as consumers switched from buying services to buying goods for delivery. Technology stocks also contributed quite significantly to total returns. By the first quarter of 2021, however, consumer discretionary stocks fell to an ‘also ran’ and technology significantly eased back on its influence. This was not because people stopped shopping and using technology in the pandemic; rather, the prices for stocks in these sectors had already been bid up to levels that made them relatively pricey. Meanwhile, the steady recovery of banking stocks and cyclical industrial stocks were the prime drivers of returns for Q1 2021.
Yet this sector breakdown of returns also gives us a glimpse of Beta’s limitations as a measure of risk and returns. Over the last two years, the Beta of the information technology sector relative to its parent S&P 500 index was close to 1.0. Yet for the last six months, that Beta shot up to 1.28 as the movements of the two indexes significantly diverged. So, for instance, if you entered 2021 with a tech-heavy portfolio but thought you had average risk with a Beta of 1.0, you might have been surprised by the fact that technology was a net drag on Q1 returns. Worse still, traders who were ‘chasing’ sector momentum usually ended up overpaying for a sector that then was a further drag on their portfolio.
Of course, quarterly results are a poor metric for measuring your investments success, even though all financial managers are required to report them. The takeaway here is that you should know your risk profile, and Beta can be one of the metrics to do that. But also understand its limitations. It can be a bit of a Trojan Horse: seemingly very friendly when it is wheeled in, but then a bunch of other Greek letters jump out from its βelly and smack you around with the other mixed metaphors. Sector diversification and broader portfolio diversification remain the best ways to ensure long term returns and avoid the pitfalls of trading in and out of very uneven-performing sectors.
- Sulzberger Capital Advisors, Inc. is registered as an investment advisor with the state of Florida. The firm only transacts business in states where it is properly registered or, is excluded or exempted from registration requirements. Registration as an investment advisor does not constitute an endorsement of the firm by securities regulators nor does it indicate that the advisor has attained a particular level of skill or ability.
- This article should not be construed as personalized investment advice or as an offer to buy or sell the securities mentioned herein. A professional advisor should be consulted before implementing any of the strategies presented. All investments and investment strategies have the potential for profit or loss. Different types of investments involve varying degrees of risk, and there can be no assurance that any specific investment or strategy will be suitable or profitable for a client's investment portfolio. Asset allocation and diversification do not ensure or guarantee better performance and cannot eliminate the risk of investment losses.
- Historical performance results for investment indexes and/or categories, generally do not reflect the deduction of transaction and/or custodial charges or the deduction of an investment-management fee, the incurrence of which would have the effect of decreasing historical performance results. Returns do not represent the performance of Sulzberger Capital Advisors, Inc. or any of its advisory clients. There are no assurances that a client’s portfolio will match or outperform any particular benchmark.
1Unless noted otherwise, all figures for this article are taken from Bloomberg data.