The Benchmark Dilemma
Why do active managers have so much trouble beating the index?
There is a silly old joke that asks how many finance professionals it takes to screw in a light bulb. The answer was 10: one to screw in the light bulb, and nine others to stand around and suggest how it could be done more efficiently. So, at the risk of being one of those nine, in this quarter’s white paper we want to explore the question of why it is so hard for any of us to do things any better than the one guy on the ladder. More specifically, why is it so hard to beat our stock index benchmarks (and is this even the right question to be asking)?
For decades now, researchers have been demonstrating that active managers in the equity market do not beat their index with any level of consistency [1]. So why is that? And if so, why does a multi-billion-dollar industry of active managers still exist? Are a lot of people just being misled?
So firstly, let’s posit that we have over-learned the lessons of avoiding active management and instead focused solely on investing in the index. If active allocation did not have a role, why do so many big university endowment funds continue to hold active stock positions (and one university, whose name we will withhold, made a 41% return last year and absolutely spanked Harvard [2])?
The principal reason why investing in the index can make sense are the lower fees, which for active funds can compound the costs over time with the sort of opposite of compounding interest. There is also, of course, the problem that people don’t believe that active management is effective, so it becomes something of a self-fulfilling prophecy. If everyone invests in the index, then no one gets any better returns than the index, but a lot of bad companies probably get propped up indefinitely.
However, there are several reasons why active management can sometimes make sense even for us mere mortals: principal among them are (1) more tailored asset class allocation and (2) management of taxes. So, let’s dive into this benchmark dilemma to understand a bit better what’s up with index investing and why so much active management persists.
An index manager (also known as a passive manager) invests in the stocks that comprise that index in the same proportions – or at least as close as they can get to it. Active managers, by contrast, can buy and sell stocks within a specific index without being required to hold all of them or having the same percentages (weighting) of each stock. Yet if you have all this Wall Street brain power working on an actively managed fund, why do they struggle to beat a passive strategy?
Can Pigs Fry and Can Cows Wear Lace Undies?
Perhaps we can use a simple example to illustrate just how much this is not a simple question. Suppose you had an index made up of just two stocks: LaceCook Inc. (ticker: LACE), a specialty apparel producer focused on men’s aprons to wear in the kitchen, and Moo Moo Hemming Inc. (ticker MOO), a company that sells cow skirts to Amish farmers who are too prudish to let their cows show their udders. Let’s also say that Moo Moo Hemming is simply crushing it, with great profits, a solid balance sheet, and very compelling growth that has all the stock analysts drooling on their Excel spreadsheets. LaceCook, on the other hand, is run by a non-charismatic billionaire CEO named Mark Upchuck, who has proceeded to run the company over a cliff with a series of high-profile deep fryer burn incidents among men who wore their High-on-the-Fry aprons with built-in French fry pouches.
Both stocks started with a $50 share price with equal market capitalizations, so the index assigned 50 points to each for a total index of 100. So, in this scenario, a passive strategy would mean that ‘holding the index’ would consist of one share of LaceCook and one share of Moo Moo Hemming for every $100 of invested capital.
Now consider what happens quarter by quarter:
First Quarter: Bob’s Big-Ask Bank LLC has some really good analysts who decide that MOO is very well priced, whereas they doubt that LACE will be profitable within a year or two, and their long-term prospects look pretty bleak. So Bob’s Big-Ask Bank decides to invest their active fund 100% in MOO with nothing in LaceCook.
Sure enough, quarterly results come in and MOO announces revenue guidance based on a new line of cow burkas called “Udderly Covered”. Middle East sales are reported to be through the roof, as MOO diversifies its offerings from the Amish farm to the Saudi desert (we might get a visit from a couple of guys with a bone saw after this). MOO’s share price soars by 100%. Meanwhile, LACE misses its analyst guidance and sees its share price pummeled – down 30%. This means that MOO is now at $100 per share, LACE at $35, and the MOO-LACE Index at 135 points:
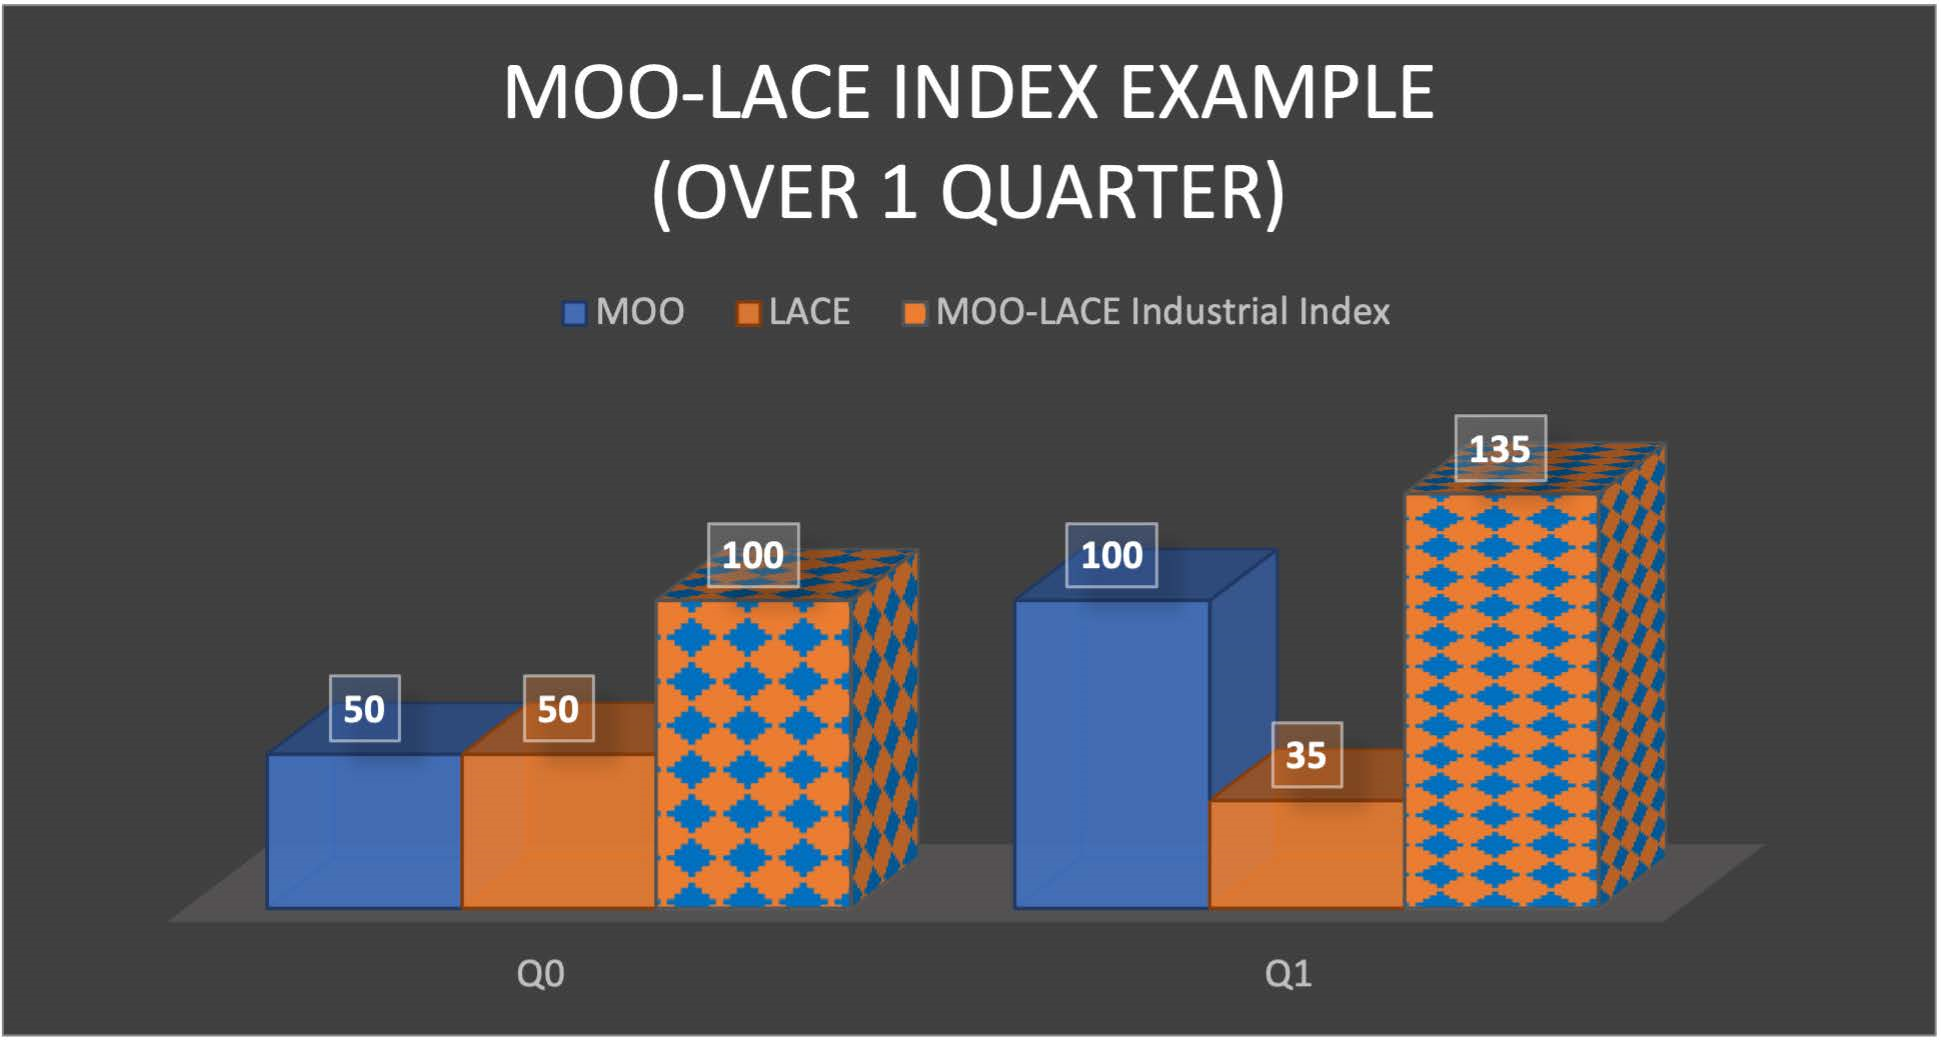
So, in this example, if you had invested $100 in the index at the beginning of the quarter, you would now have $135, or a 35% increase. In this case, Bob’s Big-Ask Bank put all of its allocation into MOO, and since MOO went up 100% over the quarter, Bob’s holds a very tidy $200 and vastly outperformed the MOO-LACE index. It would seem that having active management was a great choice, and everybody gets a huge bonus at Bob’s Big-Ask Bank (do real-life examples ever end without the banks’ employees getting big bonuses?).
But not so fast, Bob!
Second Quarter: During the next quarter, a video goes viral on Tik Tok in which Hollywood bad boy, Jake Gyllenhaal, is photographed by paparazzi walking across his kitchen wearing a LaceCook apron. The sensational attention causes a surge of interest in LACE, but with a modest bump in sales. Analysts at Bob’s Big-Ask Bank, though, think that the effect is mostly hype and hardly makes up for the company’s poor long-term profit and production issues. The bank does not change its allocation of 100% in MOO.
However, the media attention causes a really strong recovery in LACE’s share price – up 50% from the beginning of the quarter, to $52.50 – as Jake Gyllenhaal’s fans buy lots of the stock (but not the aprons). This means LACE is up a modest 5% for the year. Meanwhile, MOO eases back a little, down 10% to $90 a share. The end of the quarter now makes the tally look as follows:
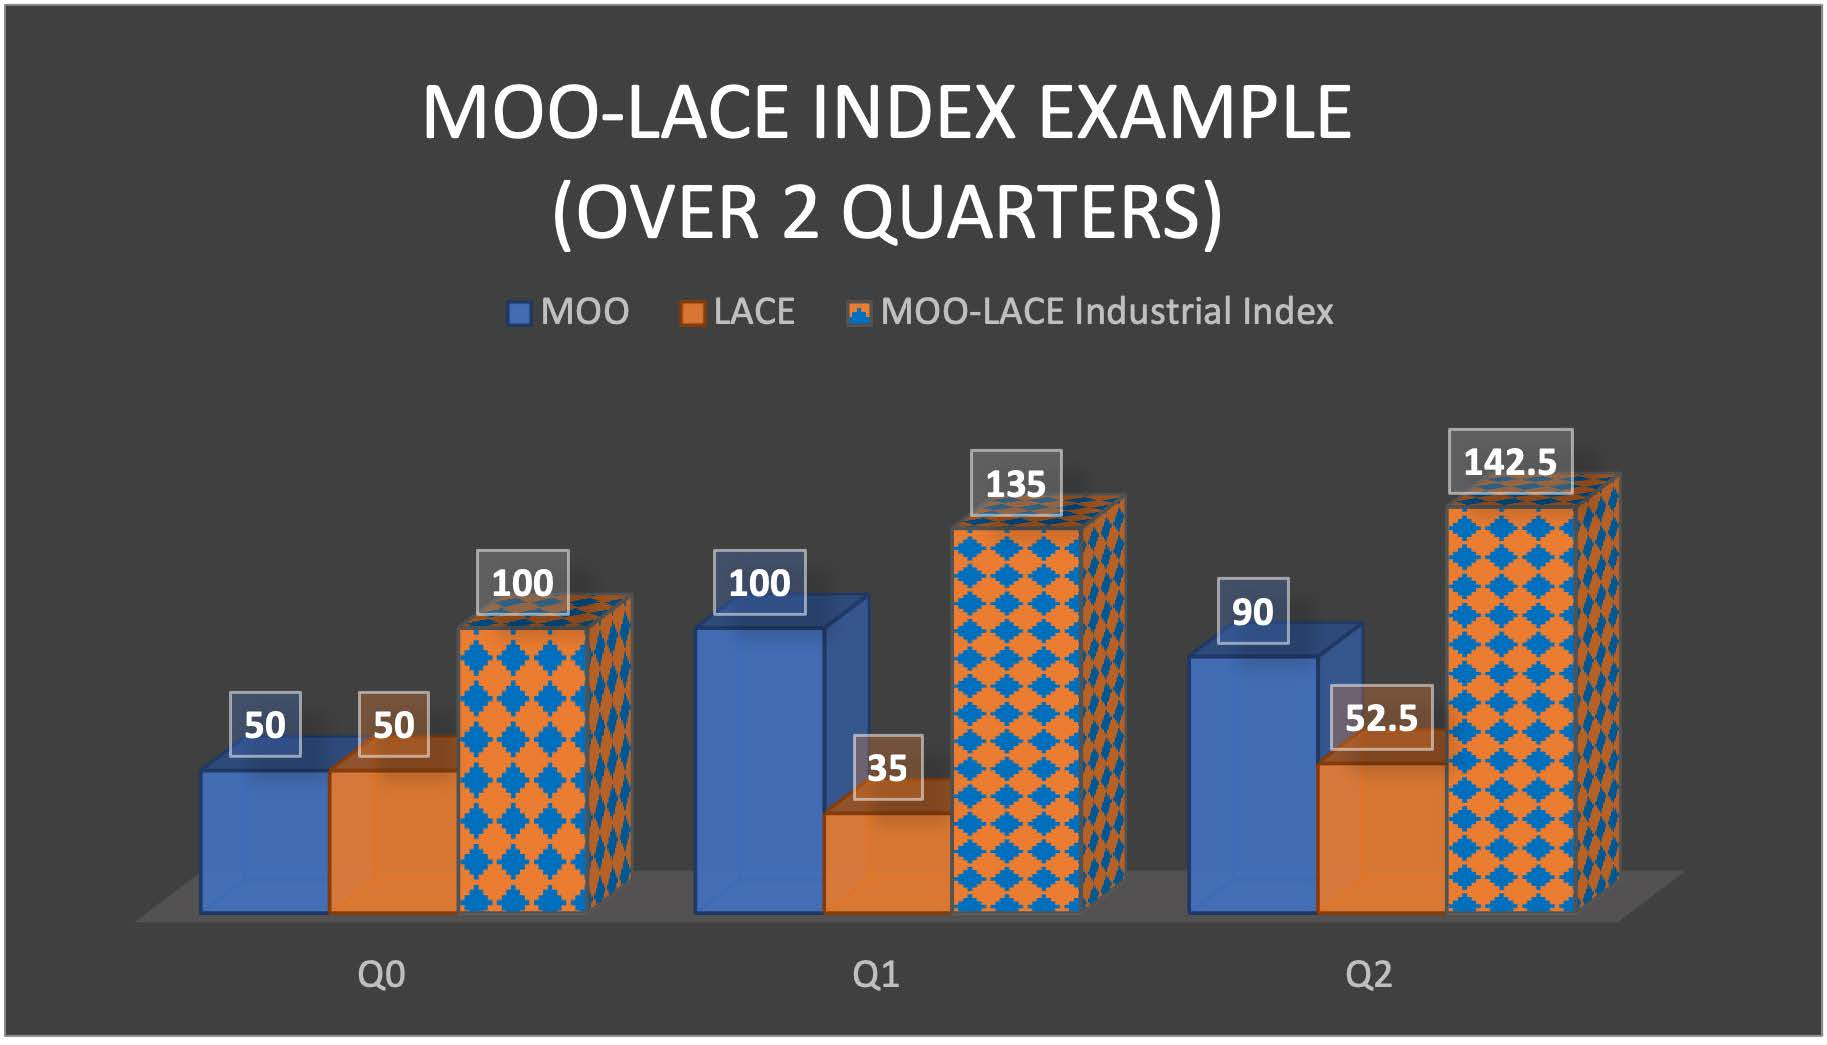
For anyone keeping score at home, if you started the year with $100 and invested it in the index, you would now have a respectable $142.50. However, if you are sitting at Bob’s Big-Ask Bank, you still deserve bonuses because you are at $180 at the end of the six months holding only MOO, whereas anyone who decided from the beginning to put all their money in LACE would be at a paltry $105. So the best result was clearly to invest in the actively managed fund at Bob’s Big-Ask Bank, which really jumped over the moon with its MOO investment pick.
But here’s the rub. Did Bob’s Big-Ask Bank consistently beat the index? You will probably say ‘yes, of course’…and you would nonetheless be wrong. Even though it ended the two quarters with a much higher aggregate value, these measures of ‘beating the index’ by active managers almost always use quarterly portfolio movement as the metric, starting each new quarter back to square one. So Bob’s Big-Ask was right during the first quarter and outperformed the index, but it underperformed the index in the second quarter in terms of its percentage change – never mind that it was still higher overall than the index.
You might say, “Well, that’s just not fair;” and you would be right (and, also, one of the first people ever to express sympathy for a big bank). Bob’s Big-Ask Bank was right on the fundamentals and LACE could very well collapse back in the third quarter and prove them right. Yet statistically, it will be chocked up as an underperformance (2 quarters over, 1 quarter under (Ah, our old nemesis, statistics)).
There are other metrics that do look at long-term performance, but that becomes a harder statistical metric to use for comparisons because it can depend very much on the exact date that an investor invests – and that can quickly become hazier. By the quarterly metric, the assumption is that Bob’s analysts should have abandoned all their fundamental views of the two companies and have jumped on the bandwagon with all the apron-loving fans of Jake Gyllenhaal, at least for the second quarter – which is not very smart, if you think about it. For an active manager to consistently beat the market (and to consistently split infinitives), they have to be good at both analyzing stocks and analyzing the ebbs and flows of internet hype, etc.
Benchmark and Taxes
“In both life and investing, nothing is absolutely sure…except maybe death and taxes. But if I had to bet between the two, I would say that taxes would have the higher probability.” - Some wizened, old finance guy whose name we forget
All of this discussion of index investing versus active management brings us to taxes (our second worst nemesis). The scenario we gave above with Bob’s Big-Ask Bank active fund underscores another point, which is that active management can be less tax efficient, at least if you hold them in a taxable fund (as distinct from something like an IRA or 401k). If Bob’s decided to sell MOO and buy LACE to beat the index in the second quarter as well – and get a perfect quarterly streak on outperformance – the fund would have likely passed through all the capital gains taxes to the investors (and higher-tax-rate, short-term gains at that). Holding the index fund as an exchange traded fund (ETF) would likely not pass any or very little in the way of gains to you, the investor.
In our theoretical example, the investor would have been on the hook for $60 of taxes if Bob’s B-A B had switched back and forth between MOO and LACE at the end of each quarter. They would have increased the value to a whopping $300 (versus $142.50 if they had just held the index); but a lot of investors can be a little surprised to suddenly learn that they have such a big tax bill without having sold anything themselves. Moreover, this is a bit of an extreme example (who, us?). If Bob’s B-A B had guessed wrong after the first quarter, the investor would have realized $30 of taxes without necessarily getting the additional increase in value for their investment [3].
Beating the Benchmark, or Beating Back Taxes?
As we have seen, it is very, very hard to beat the market consistently on a quarterly basis, but there are a small number of managers who do beat their benchmarks a significant amount of the time. Moreover, as you saw in the first example above, sometimes a fund manager can be significantly ahead for a longer period than just quarter-by-quarter, even if the manager underperforms in a bunch of quarters. Warren Buffet is one of those types of investors who sticks to the fundamentals and takes a pass on the hype. The question shouldn’t really be “does the manager consistently beat the market?” but rather “but how much is the manager’s strategy likely to outperform its benchmark over your investment time horizon without taking on a significantly higher amount of risk or realizing too much tax liability for your specific circumstances?” That’s a mouthful. You can see why financial journalists default to asking the first question. You can also see why this becomes so complicated so quickly to the point where so many people just default to investing in an index fund for a broad market.
That kind of leads to the question “why would anyone ever want to invest in individual stocks?” It is very hard to beat the market and you don’t want to have excess capital gains passed through to you in a way that hurts. And therein lies one of the key answers to that. When you hold individual stocks, you have significantly more control over when you will realize taxes as well as the types of income that you would receive for taxes. This is particularly important if you may be taking money out of your taxable account on an irregular basis. Using the same MOO-LACE example above, suppose an investor invested directly in MOO and LACE in the same proportions as the index. Let’s also suppose that they needed to make a $50 withdrawal after the second quarter ended and wanted to be tax efficient about it.
If you are invested solely in the index fund, you have to take capital gains: no way around it. The index is up $35 (35%) by the end of the first quarter, that’s a significant short-term gain. However, if you held the same companies but in individual stocks, you could withdraw more money from LACE shares at the end of the first quarter and make up the balance in MOO shares and emerge with no capital gains. In that example, it is the equivalent of ending the two quarters with $85 versus $80.78 if it were all sold from the index fund. Of course, that can be meaningful money, particularly over time.
Overly precocious investors will raise their hands and point out that this is not the same outcome. You can’t then hold the same weightings of the index in the second quarter because of the IRS’s secret weapon: the wash sale rules. The IRS doesn’t allow you to take the losses and then turn around and buy the same stock within 30 days. Yet this is always presented as if it were more constraining than it sounds. A different, wizened old finance guy once said, “if you can’t find a roughly equivalent stock amongst the 500 stocks of the S&P 500, then you’re just being lazy” (these wizened old finance guys are always such a joy). The point is that it is not that hard to reconstruct something that approximates the index while getting to choose when – and whether – you are going to take any capital gains. We should also stress that there are a whole host of other reasons you might want to hold individual stocks, such as customizing your risk profile, taking less (or more) dividend income, and changing the sector allocation of the index you are using as a benchmark.
This last point is important, and probably worth a white paper on its own. We always talk about passive strategies with index funds; but, remember that the indices are all different not just in their stock composition, but also in their sector weightings. You often hear financial journalists refer to the “tech-heavy” NASDAQ, because of the strong representation of technology companies in it compared to the Dow Jones or S&P 500 – yet there is also a lot of overlap between them, which makes it more complicated to try to diversify using only index funds. Also, international indices are not constructed with the same sector allocations. For instance, European indices are much more weighted toward banks and financial stocks than the U.S. indices, and that means they often yield higher dividends but with less robust growth. To illustrate the importance of this, I am reprising a graph from our January note updated to the third quarter 2021.
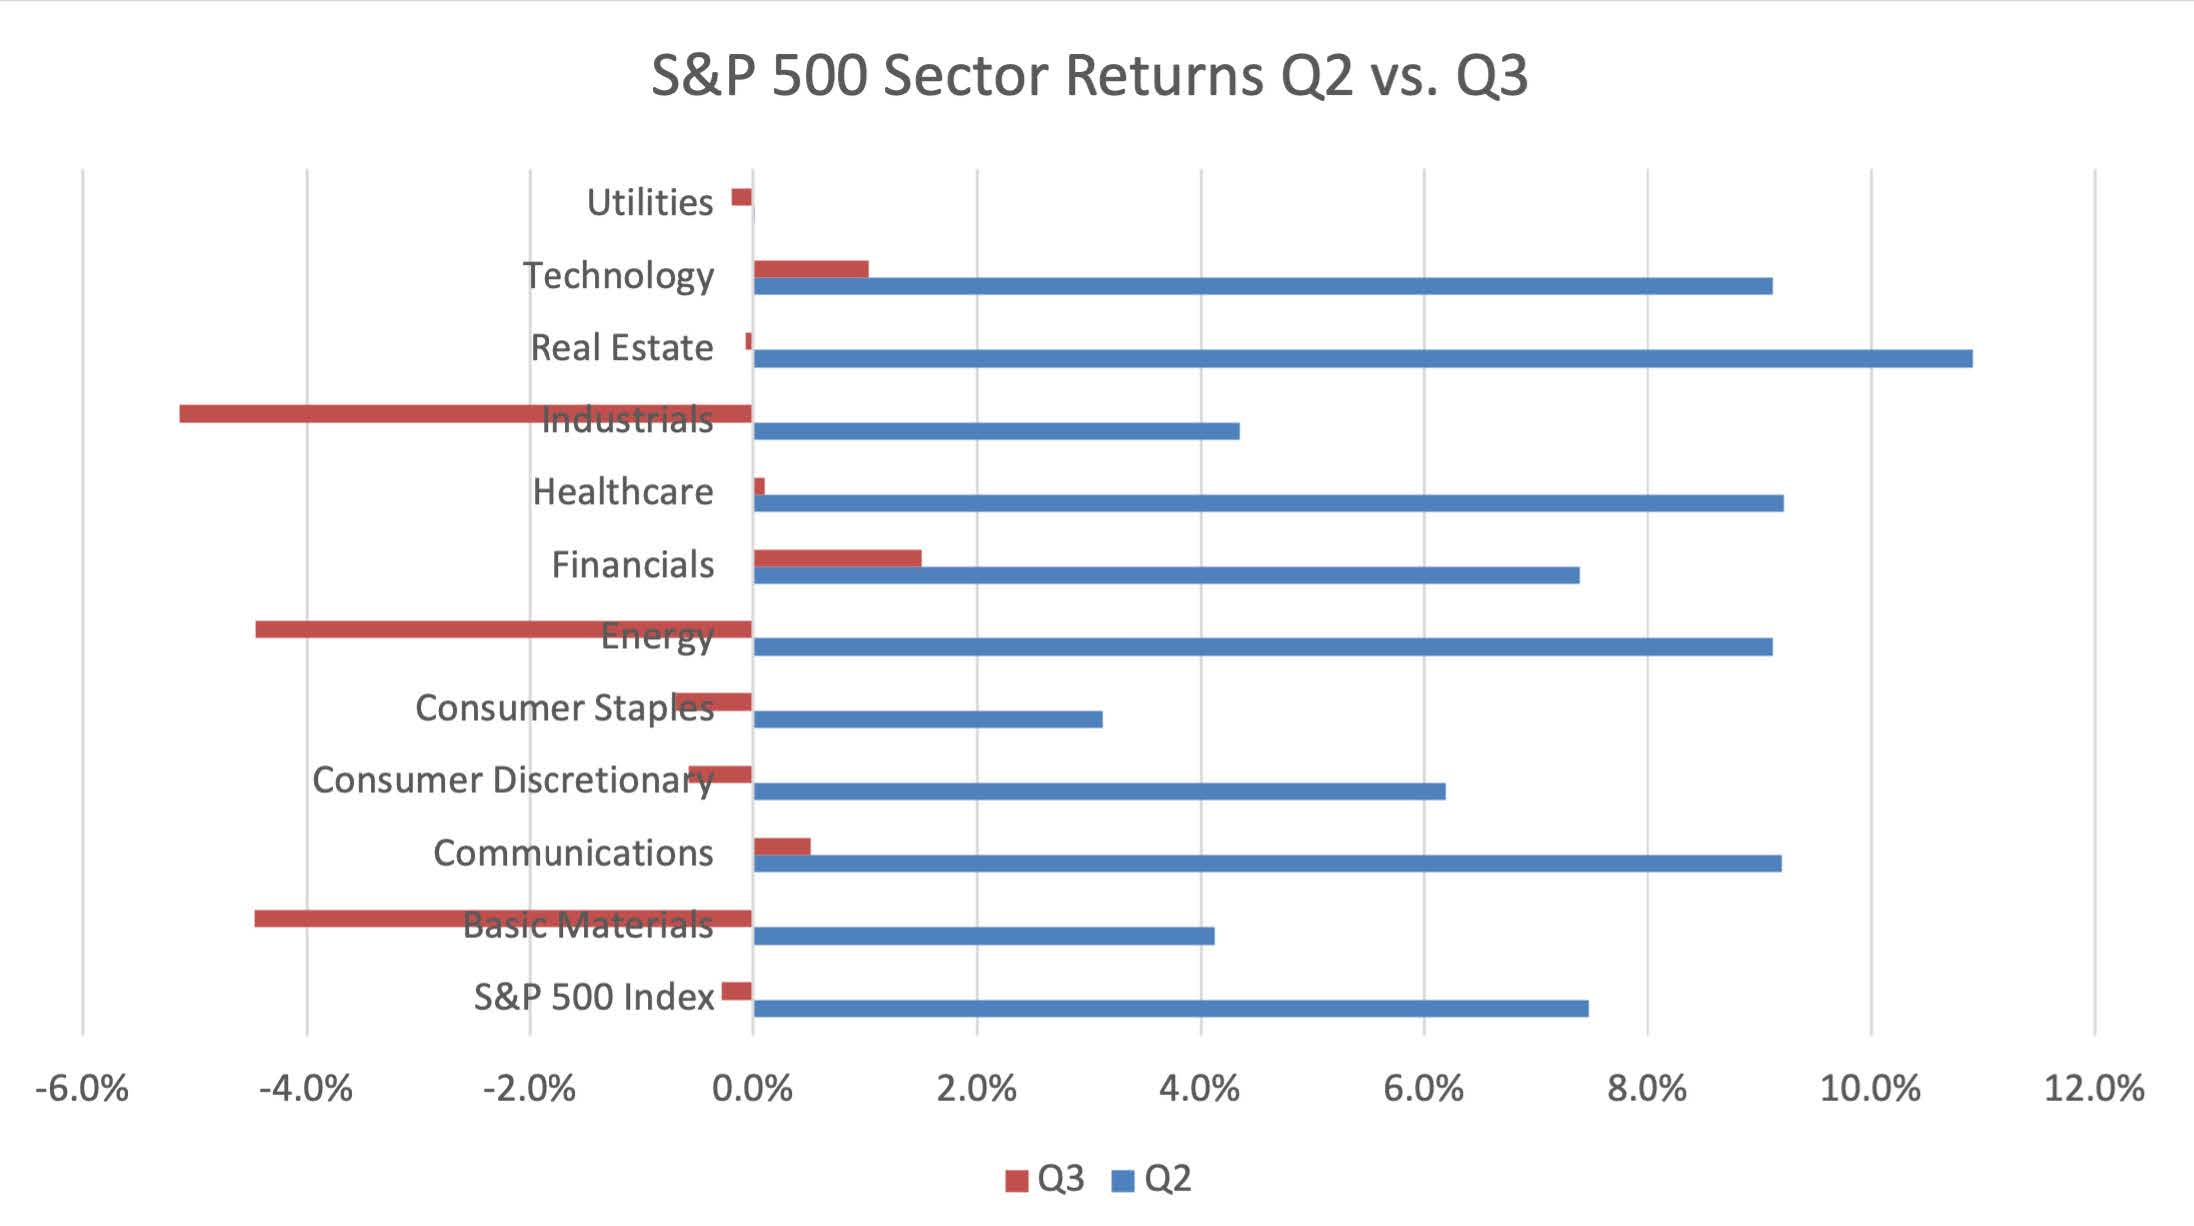
While performance between sectors within the S&P 500 in 2021 was somewhat less divergent as it was in 2020, you can see that there can be a lot of variation within any quarter between the index’s performance and that of its constituent sectors. This is one of the most basic ways that traders position their active allocations – simply by making conclusions of which sectors to ‘overweight’ and ‘underweight’ (in terms of whether it is more or less than the percentage of that sector in the index).
Three sectors – Industrials, Energy, and Basic Materials were almost the inverse of themselves between the returns from the price appreciation in Q2 versus the price drop in Q3. Indeed, pretty much all of the performance change from a 7.7% return in Q2 to a slight loss in Q3 could be accounted for by the reversal in fortunes of just those three sectors. An active manager who correctly forecasts these sector performance directions – not necessarily amounts, but just direction – could easily have made a better return with relatively modest re-weightings.
It’s also very important to point out that anyone can create an index; and then, they can build an index fund to track it. If you want to create an index called the “Billionaires-With-Big-Space-Rockets Index,” you must decide which of the many billionaire space companies should be included and at what weightings, and voila: you have an index. If you or someone else wants to register a fund that invests passively in that index, well…you can have at it (mind you, that’s harder than it sounds). Indeed, you could establish that index and then set up a fund that seeks to do the opposite of what those companies are doing – or double what they are doing (a 2x Beta fund, for those of you who may have read our March white paper). So, once you layer on the vast array of specialty indices, the distinction between the actively managed funds and the passive index funds starts to get decidedly hazier.
The two biggest index-following ETFs in the U.S. track the S&P 500 index and the CRSP US Total Market Index, respectively. While most of us have heard of the former (or at least had a 401k fund that tracked it), the latter is certainly not a household name. That’s because indices are also proprietary, branded weightings with lots of calculations behind them. Vanguard really doesn’t want to give the Russell 3000 or Morgan Stanley’s MSCI indices any free publicity, because they are also potential competitors. So even though VTI is rapidly becoming as important as the S&P 500 (SPY) ETF, you are not going to hear Kai Ryssdal on NPR giving the daily market numbers for the CRSP US Total Market Index every day, alongside the ‘major’ indices (we love you Kai, but get it together).
Conclusion: There is no Conclusion
There are no easy takeaways on active versus passive management, except perhaps that there is not really one conclusion that fits all. People who are looking for a simple mantra like “active managers don’t beat the index” or “it’s better to hold funds rather than individual stocks” are over-simplifying things. At the risk of trying to over-simplify things ourselves, here are a few points worth bearing in mind:
- There’s a Place for Active Management. While the problems with active management are generally true (they have more expensive fees, do not consistently beat their index, and can be tax-inefficient), that doesn’t mean there are not specific circumstances in which an active strategy might not be right for a given portfolio or as one part of a portfolio. For instance, some countries have strangely weighted indices where active management may be a better fit if you want some investment there. Moreover, even in the good, old U.S., smaller capitalization indices can be places where active managers can generally add more value than in the large-cap space;
- Don’t lose sight of the importance of allocation by asset class. Holding individual stocks might not be an active strategy, per se, but rather just a way of changing your asset class allocations to account for overlap elsewhere.
- Consider the tax implications when determining whether you are deciding on a position in individual stocks, actively managed funds, or passive index funds. For instance, if you decide you want to put an actively managed fund in a taxable account, you have to be prepared for more capital gains being passed through by managers than you would likely get from either a passive index fund or even your own stock selections in which you can control the timing of taxable gains. In some cases, it may be better to allocate active funds to an IRA or 401k so that the tax effects are deferred.
- Understand the taxes, taxes, taxes, and, also, taxes.
- See the previous point on taxes.
- Did we mention taxes? If this seems overwhelming, the good news is that the plethora of funds, indices, and asset classes provide a lot of tools in the toolbox. It is much easier to customize investors’ portfolios to meet your needs and tailor income, growth, and risk in a tax-efficient manner than it was even 30 years ago.
1 See for instance: Global Equity Fund Performance: An Attribution Approach, David R. Gallagher, Graham Harman, Camille H. Schmidt, and Geoffrey J. Warren, Financial Analysts Journalist, CFA Institute, Quarter 1 2017.
3 This is where we are obliged to say that every investor’s tax situation is different, and you should check with your accountant or financial advisor. Sulzberger Capital Advisors does not provide tax services and can only refer any investment tax problems to your tax professional.
- Sulzberger Capital Advisors, Inc. is registered as an investment advisor with the state of Florida. The firm only transacts business in states where it is properly registered or, is excluded or exempted from registration requirements. Registration as an investment advisor does not constitute an endorsement of the firm by securities regulators nor does it indicate that the advisor has attained a particular level of skill or ability./li>
- This article should not be construed as personalized investment advice or as an offer to buy or sell the securities mentioned herein. A professional advisor should be consulted before implementing any of the strategies presented. All investments and investment strategies have the potential for profit or loss. Different types of investments involve varying degrees of risk, and there can be no assurance that any specific investment or strategy will be suitable or profitable for a client’s investment portfolio. Asset allocation and diversification do not ensure or guarantee better performance and cannot eliminate the risk of investment losses.
- Content should not be viewed at personalized investment advice. Market events and other factors may affect the reliability of the potential outcomes. Simulated growth is purely hypothetical and does not represent actual performance.
- Projected growth may be better or worse than the projections. Projections are based on assumptions that may not come to pass and are used for illustrative purposes only. Projected growth does not reflect the impact that taxes, investment expenses, and advisory fees will have on the results. Projections are derived from sources deemed to be reliable. No warranty or guarantee is made as to their accuracy or completeness. Social Security rules and regulations and tax laws are subject to change at any time.
- Asset allocation and diversification do not ensure or guarantee better performance and cannot eliminate the risk of investment losses. All investment strategies have the potential for profit or loss. Changes in investment strategies, contributions or withdrawals, and economic conditions may materially alter the performance of an investor’s portfolio. Different types of investments involve varying degrees of risk, and there can be no assurance that any specific investment or strategy will be suitable or profitable for an investor’s portfolio.
- Content should not be regarded as a complete analysis of the subjects discussed. All expressions of opinion reflect the judgment of the authors on the date of publication and are subject to change.
- All information is based on sources deemed to be reliable, but no warranty or guarantee is made as to its accuracy or completeness. Discussions should not be construed as recommendations by Sulzberger Capital Advisors, Inc. to buy or sell any specific security.
- Different types of investments involve varying degrees of risk, and there can be no assurance that any specific investment or strategy will be suitable or profitable for a client’s portfolio. Past performance may not be indicative of future results. Changes in investment strategies, contributions or withdrawals, and economic conditions may materially alter the performance of your portfolio.
- All investment strategies have the potential for profit or loss. Historical performance results for investment indexes and/or categories, generally do not reflect the deduction of transaction and/or custodial charges or the deduction of an investment-management fee, the incurrence of which would have the effect of decreasing historical performance results. There are no assurances that a client’s portfolio will match or exceed any particular benchmark. Asset allocation and diversification do not assure or guarantee better performance and cannot eliminate the risk of investment losses.